
by Randall Bartlett
How much can the federal government blame its sizeable deficits on the economy? As it turns out, not all that much. And less than most probably think, particularly given the weakness of the economy and labour market in 2015 and 2016.
Primed by an email exchange with some folks in the media, the Institute of Fiscal Studies and Democracy (IFSD) thought we would dig into the numbers to see how much of the current federal fiscal predicament is the result of deliberate decisions or exogenous forces. To do this we’ve compiled the economic forecasts from Budget 2015 through Budget 2018 and the fiscal impact estimates of economic shocks published in said budgets, as well as drawing from the 2015 Liberal Party of Canada election platform, analysis from the Parliamentary Budget Officer (PBO), and the Bank of Canada’s July 2015 Monetary Policy Report.
It is also worth noting at the outset that none of the following analysis is linked to the IFSD’s Federal Fiscal Forecast, but instead draws from the aforementioned organizations and documents. The IFSD’s next Federal Fiscal Forecast will be published after the release of the Annual Financial Report of the Government of Canada, Fiscal Year 2017-18.
Taking the Wayback Machine to 2015
But to understand the impact of the economy on the current fiscal situation, we need to look back at where we’ve been. Specifically, oil prices peaked in mid-2014 at over US$100 per barrel of West Texas Intermediate (WTI). After that it began a freefall which didn’t end until prices closed at just under $US30 per barrel in January 2016. The spectacular decline took markets by surprise, as it did the federal government at the time.
As time passed, it became increasingly clear that there was a new paradigm at play. Consequently, as the view became more widespread that oil prices were going to stay low for long, new investment in the oil patch began to dry up and pink slips were handed out. Government revenues started to fall while expenses ticked higher, particularly in energy-rich provinces and to a lesser extent at the federal level.
Throughout this period, the federal government remained resolute in its commitment to return to a budget surplus by the time of the 2015 federal election. However, an increasing number of pundits began to speculate as to whether or not a budget surplus was going to be in the cards. The first set of numbers that gained traction were from TD Economics, which determined that “The conclusion is unambiguous. In the absence of new measures to raise revenues or cut spending, TD is projecting budget deficits in fiscal 2015-16 and 2016-17 as opposed to the surpluses expected at the time of the Update.”
Shortly after the release of these findings, the federal government postponed the release of Budget 2015 until April 2015, following the end of the 2014-15 fiscal year. This allowed for the proceeds from the sale of GM shares to be booked in the 2015-16 fiscal year, along with proposed changes to public service sick leave and other measures. When combined with some creative accounting and a smaller than usual ‘Adjustment for risk’, the federal government was able to project a surplus in fiscal 2015-16 in the face of falling revenues.
As it turned out, all of this effort put into eking out a budget surplus didn’t matter much. The Canadian electorate was looking for a change, and they were willing to entertain short-lived and modest budget deficits. So, the Liberal Party of Canada replaced the Conservative Party of Canada as the Government of Canada for the October 2015 federal election. And with the change in government came changes to the fiscal outlook and the realization of the long-standing parliamentary tradition of accusations of misrepresentation and obfuscation of the budget numbers.
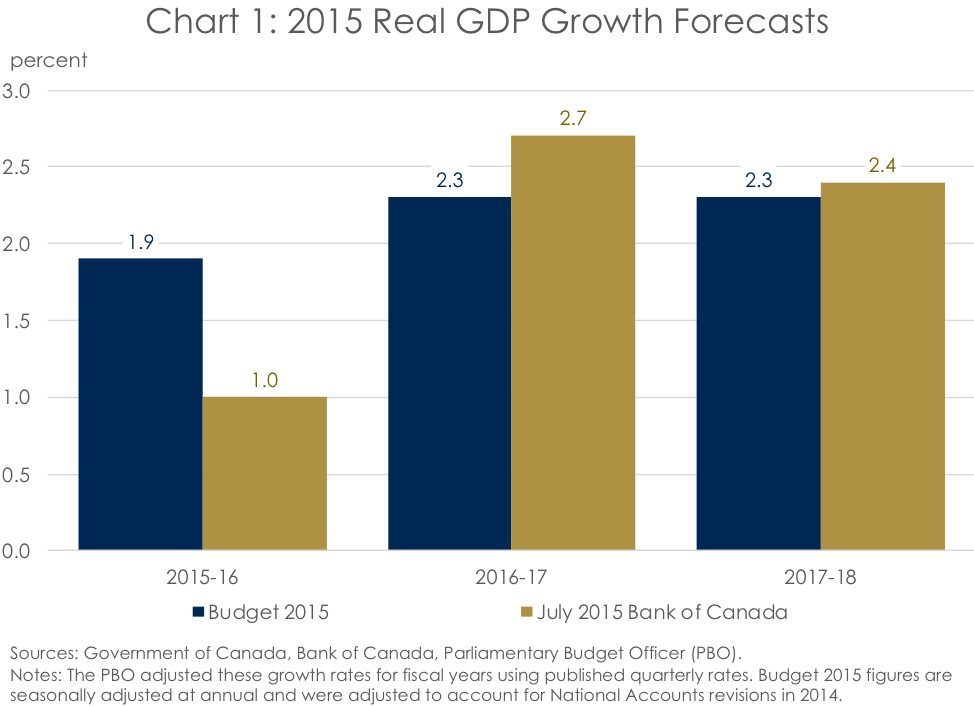
Part of the deficit-sales job by the Liberal Party of Canada to Canadians was the view that the economy was weaker than the Government of Canada had thought when the budget was published in the spring of 2015. And, indeed, economic forecasts had softened considerably over from March to July 2015. As such, Opposition Members of Parliament (MPs) asked the Parliamentary Budget Officer (PBO) to “provide an update of the Government’s fiscal projections in Budget 2015 using the Bank of Canada’s outlook in its July Monetary Policy Report. PBO will update its own Economic and Fiscal Outlook in the fall.” The change in the economic outlook was largely concentrated in real GDP growth, was revised lower in July 2015 by 0.9 percentage points in the 2015-16 fiscal year (Chart 1). At the same time, the real GDP growth outlook for the 2016-17 and 2017-18 fiscal years were revised slightly higher.
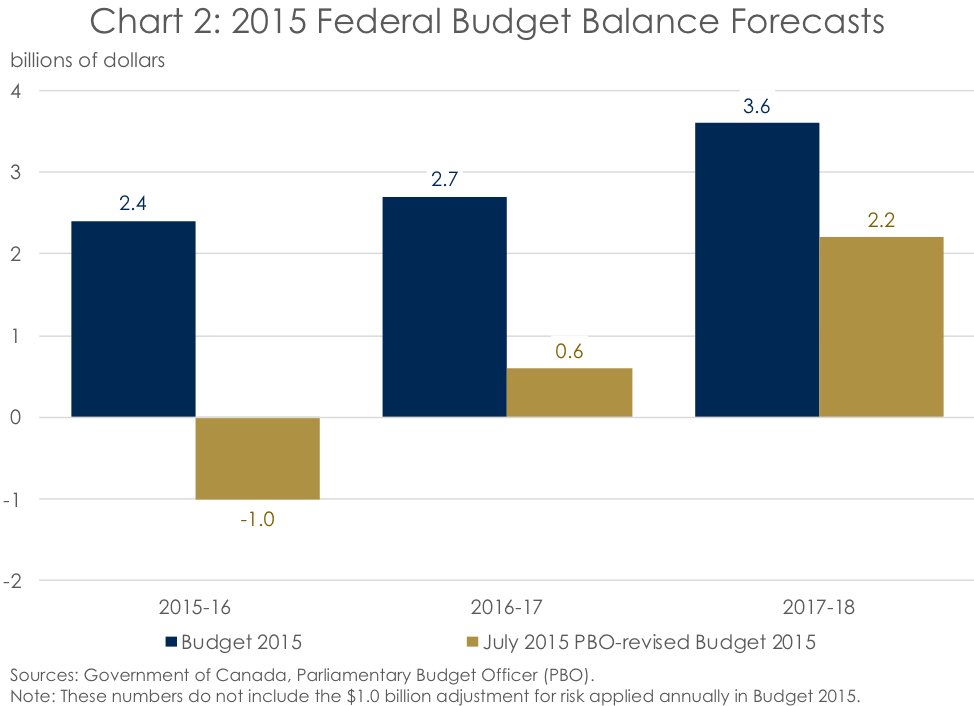
The PBO then incorporated these numbers, as well as more modest changes to the forecasts of GDP inflation and interest rates, into a revised Budget 2015 deficit outlook. The PBO estimated that the budgetary balance would be lower by $2.3 billion annually on average from the 2015-16 through 2017-18 fiscal years, with the largest annual revision taking place in fiscal 2015-16 (Chart 2).
The Liberal Party of Canada then took these revised budget balance forecasts as the starting point for the fiscal planning framework in their 2015 election platform. It then layered on ‘New revenue’ measures and ‘New investment announced’ to reach the projected budget balance that formed the basis of its fiscal plan (Table 1). The forecast was also extended out an additional two fiscal years beyond the PBO’s projection, with the ‘Estimated impact of reduction in economic growth’ for fiscal 2018-19 and 2019-20 having no explanation as to how they were determined.

Unfortunately, these categories of new measures were a blend of both revenues and expenses, and as such are not an accurate representation of the net changes in revenues and expenses that were proposed in the 2015 Liberal Party of Canada election platform. Specifically, proposed tax cuts and increased tax benefits, ranging between $25.6 billion in the 2016-17 fiscal year and $27.3 billion in fiscal 2019-20, were categorized as ‘New investment’. Subtracting this amount from new both ‘New revenue’ and ‘New investment announced’, it can be observed that projected revenues and expenses were both lower than what was telegraphed during the 2015 election (Chart 3). It can be observed that revenues were anticipated to be little changed, in aggregate, relative to the forecast in Budget 2015 (Chart 4). Meanwhile, expenses were anticipated to be much higher, coming in over $10 billion more than forecast in Budget 2015 in most years (Chart 5).


The federal government is a big spender on a bender
Now that we’ve established where the outlook for spending was at the time of the 2015 election, it can be used as a baseline to determine how things evolved afterward. In that context, the 2015 Update of Economic and Fiscal Projections very much set the baseline for taxing and spending over the rest of the mandate. In the Update, the federal government’s economic outlook was broadly in line with that of the PBO in July 2015, albeit slightly more muted in the outer years. This was particularly true with regard to GDP inflation. Notably, in the absence of any new measures, the Government of Canada was projecting deficits over the course of the mandate until returning to surpluses in the 2019-20 fiscal year (Chart 6). Lower revenues consistently made up the lion’s share of the deteriorating fiscal outlook, although expense also made a significant contribution. And in Budget 2016, things got even worse. So much so that the federal government felt compelled to publish a forecast before the budget in February 2016, priming Canadians for the near $30 billion deficits that would be coming, blaming much of the drag on the moribund performance of the Canadian economy.

But how much could the federal government really blame its worsening fiscal outlook on the deteriorating economic outlook? Revenues fell considerably between the 2015 Update and Budget 2016, thereby substantiating some of the government’s narrative. However, expenses were also projected to below lower-than-anticipated over the forecast as a result of the weaker economic outlook, as weaker inflation and lower interest rates pulled expenses lower. Consequently, the projected deficits in Budget 2016 would have been much smaller in the absence of new policy measures than the federal government ultimately published (Chart 7).

Instead, the forecasted deficits in Budget 2016 were enormous, on the back of lower revenues and increased spending. And this pattern has yet to change, persisting through to the most recent federal budget, Budget 2018.
That said, there is more going on under the surface that may be evident at first. Indeed, despite all of the changes in revenue measures that have taken place, the outlook for revenues since Update 2015 based only on the evolution of the economic forecast is similar to the actual historical and forecasted tax take in Budget 2018 (Chart 8). This implies that the aggregate impact of the tax policy changes that have taken place since Update 2015 have largely been ‘a wash’ in terms of their impact on the fiscal outlook. This view is supported by recent analysis from the federal Department of Finance.

In contrast, the outlook for larger deficits than anticipated in Update 2015 can largely be chalked up to significantly higher expenses than is warranted by the evolution of the economic forecast (Chart 9). Indeed, while the moribund Canadian economy in 2015 and 2016 put downward pressure on expenses, through lower inflation and interest costs, the federal government not only spent these savings but just kept on spending thereafter.

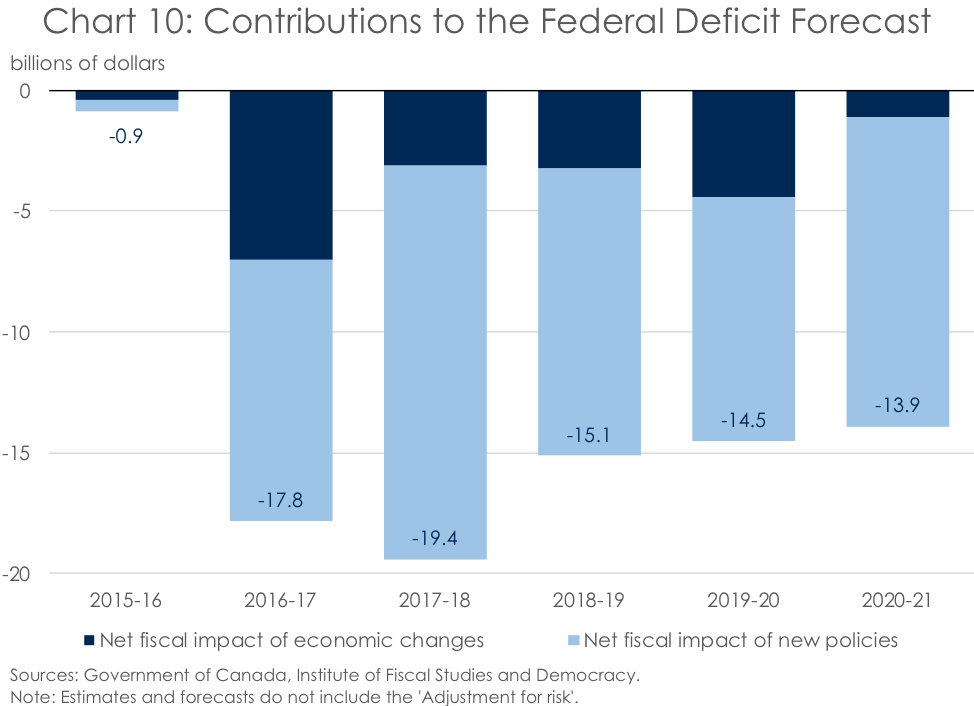
As a result of these findings, it is clear that the large federal deficits being experienced now and in the future can be primarily chalked up to spending which is well beyond anything related to the state of the economy (Chart 10). This makes the commitment to ‘Balance the budget in 2019/20’ expressed in the Minister of Finance’s mandate letter, and its being considered ‘Underway – with challenges’ in the Privy Council Office’s Mandate Letter Tracker, seem somewhat insincere.
Conclusion
The substantial increase in the spending track relative to revenues is particularly relevant as the Canadian economy has returned to its trend (see the IFSD’s September 2018 Canadian Economic Forecast for more information). As a result, the current federal deficits are entirely structural in nature, meaning there is no business cycle justification for running these deficits. This points to higher inflation and interest rates to come than would otherwise by the case. Therefore, if the federal government wants to reign in its protracted deficits in the future, it should first look to spending, as this is the primary diver of its structural deficits. That said, IFSD research continues to find that the federal government is in a fiscally-sustainable position, meaning the debt-to-GDP ratio is project to fall over the long term – a view further reinforced by more recent research published by the PBO. But as interest rates rise and economic growth slows, this plum fiscal position could be put at risk. As such, the federal government would be wise to set some money aside for a rainy day.