
by Dominique Lapointe
Following the release of Statistics Canada’s June 2018 Labour Force Survey (LFS), the Institute of Fiscal Studies and Democracy (IFSD) has updated its Canada JØLTS for May 2018. It has also launched its new Nowcast of the Bank of Canada’s (BoC’s) Wage Common measure of underlying wage growth.
- Unemployment outflows and inflows from Canada JØLTS and labour shortages intensity from the BoC’s Business Outlook Survey suggest the Canadian labour market has reached cruising altitude.
- No dramatic gains in employment should be anticipated in the future, but the labour market will remain tight, drawing in Canadians that were previously not in the labour force.
- The IFSD’s estimate of domestic wage pressures (wage common) was 2.4% both for the first and the second quarter of 2018 –– a pace that is expected to accelerate as the unemployment rate remains near record lows.
- Wage pressures, one the key drivers of core CPI inflation, continue to build and are among the factors supporting the IFSD’s call for a BoC rate hike of 25 basis point on July 11. But with trade protectionism on the rise stateside and beyond, we remain on the fence as to whether one more rate hike will be in the cards after July and before the end of 2018.
Economic and Monetary Implications
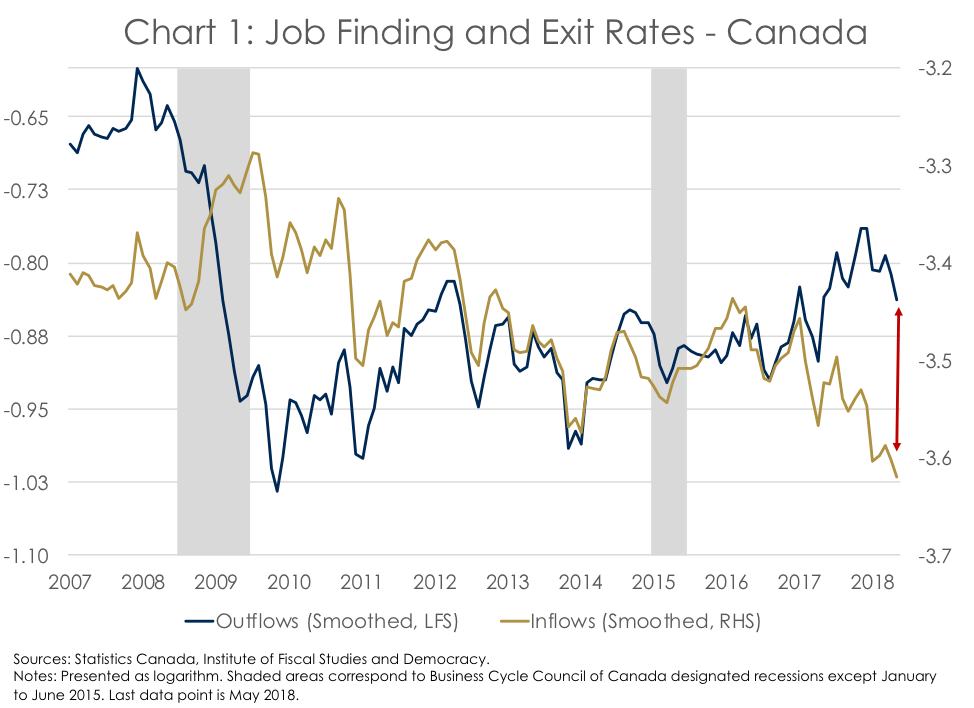
In May 2018, the unemployment outflow rate, the “speed” at which unemployed people find a job, declined by 5%, and the inflow rate, the “speed” at which employed people lose or quit their job and become unemployed, was essentially unchanged. The downward movement in the outflow rate was nevertheless not large enough to move the unemployment rate, stable at 5.8% for a fourth consecutive month (the unemployment rate subsequently increased to 6.0% in June).
The JØLTS for May 2018 continues to suggest a stabilization of movements in and out of the unemployment pool (Chart 1). With that said, the trend illustrated by the 3-month moving average of the unemployment outflows and inflows is still intact, with the former firmly trending up since the end of 2016 and the latter trending down. The gap between the relative speed at which unemployed people find a job and employed people lose or quit their job continues to support the idea that the labour market in the country is tight and that no significant slack remains outside of the energy-related industries.[1]
Several other labour market indicators also support this conclusion. For instance, the IFSD’s employment gap––the percent difference between the levels of actual employment and trend employment––remained well into positive territory in the second quarter of 2018 (Chart 2). This points to a labour market that basically has no slack to spare and is indeed operating beyond its capacity.

Further to this view, the IFSD’s estimate of the job layoff rate touched a new record low of 0.6% in the second quarter of 2018 (Chart 3).[2] The vanishing need to layoff workers is reinforced by the BoC’s latest Business Outlook Survey (BOS). In the second quarter of 2018, 34% of Canadian firms reported facing labour shortages, up from 26% in the first quarter of the year and representing the highest percentage since 2008. However, the intensity of labour shortages has been stable since the second half of last year, with a net percentage of firms reporting more intense labour shortages hovering around 35%. Hence, the stable trends in both the Canada JØLTS and labour shortages reported in the BOS lead us to conclude that the Canadian labour market has reached cruising altitude.

Wages Pressures Are Building Up
One consequence of an economy operating at or beyond its capacity with very few qualified workers currently unemployed and looking for a job is that no dramatic employment gains should be anticipated in the near future. Another consequence is that the current tightness will exacerbate domestic labour costs. Indeed, as firms compete to attract and retain their most productive workers, higher wages and salaries will be more prevalent. This was confirmed by the latest BOS, with Canadian firms in industries with “fully utilized labour forces” being pushed to raise wages. In the second quarter of 2018, 27% of firms reported an inability to find labour at the current offered wages as their main obstacles to meet demand––the highest such percentage since 2012.[3]
Wage pressures are also evident in traditional measures of wage growth published by Statistics Canada. In the first quarter of 2018, average hourly wage growth measured by the Labour Force Survey (LFS) reached 3.2% and has accelerated to 3.7% in the second quarter. This is much stronger than the historical average of 2.7% since 1998. Wage growth measured by the Survey of Employment Payrolls and Hours (SEPH) increased to 2.8% in the first quarter of the year. But, wage growth measures from the quarterly national accounts (NAC) and the quarterly productivity indexes (PA) slowed down 1.9% and 2.1% in the first quarter, respectively (Chart 4).

To see through this volatility, the Bank of Canada developed a measure of domestic wage pressures, the wage common (Brouillette, Lachaine & Vincent, 2018). This measure extracts a common, unobserved factor between each wage growth measures and is assumed to reflect the “true” underlying wage growth pressure. To provide a timely estimate of wage common, the IFSD also developed its own nowcast and estimate of wage common, albeit with a slightly different methodology (Chart 4).[4] The most recent BoC wage common was 2.3% in the fourth quarter of 2017. In the first and second quarter of 2018, the IFSD wage common is stable at 2.4%. Moreover, if one would use the IFSD wage common to forecast the BoC wage common, wage pressures would be stable at 2.5% in both the first and second quarter of 2018. This suggests that wage pressures continued to build up, albeit at more moderate pace, in the first half of the year.
From Cautious to Gradual
Current wage pressures are supportive of the BoC’s choice of language in its latest overnight rate decision, in May 2018. Specifically, the BoC stated in May that a gradual approach to monetary policy normalization, rather than a cautious approach, as written before, was warranted. Indeed, with the output gap basically closed and with practically no labour market slack remaining alongside wage growth accelerating, the ground was sturdier to engage in a “data-dependent” tightening cycle. The IFSD, in line with the consensus, expects a 25 basis point rate hike, from 1.25 to 1.50%, at the July 11 announcement. Additionally, during the Q&A session that followed his final speech before the July 2018 interest rate decision and Monetary Policy Report, Governor Poloz provided hawkish overtones. “The way we think of this is that the economy is operating very close to its capacity and inflation’s on target, so we’re more or less what I’ve described as ‘home’ in other speeches,” Bank of Canada Governor Stephen Poloz said. “And the thing that looks odd in that picture is that interest rates are still very low by historical standards.” Governor Poloz was also clear that the BoC looks at the “big picture” and that it won’t be derailed by “single data points” (Bloomberg News, 2018).
However, Governor Poloz highlighted in the same speech that setting monetary policy “is a matter of risk management”. The Governing Council aims to “manage and balance those risks”. Considering impending risks to international trade and household imbalances domestically, interest rates are poised to be raised more gradually than they would otherwise based on current economic conditions. Indeed, while June employment data released last Friday was solid, we’ll get the first glimpses of the impact of U.S. tariffs on steel and aluminum on Canadian exports with the release of June trade data in a little less than a month from now. How these economic data and others reflect the possible realization or relief from the key risks highlighted above will be key to assessing whether or not another rate hike is in the cards before the end of 2018.
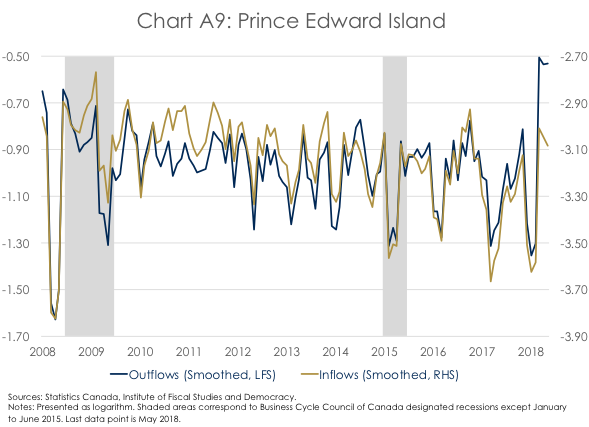
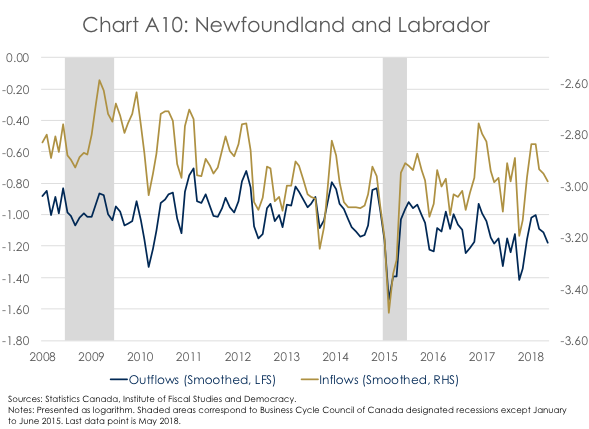
Annex 1 – Provincial JØLTS


Annex 2 – The IFSD Wage Common
Four wage growth measures are currently being monitored by the Bank of Canada: hourly wage growth from both the Labour Force Survey (LFS) and the Survey of Employment Payrolls and Hours (SEPH), hourly compensation from the Productivity Accounts (PA), and wages and salaries from the quarterly National Accounts (NAC). Since wage pressures derived from the above series come from different surveys and administrative data, they can at times provide contradictory signals about the extent to which the economy is generating inflationary pressures. For example, LFS wage growth did not capture the underlying weakness in the economy in 2015 and 2016, in the midst of the oil price crisis that intensively hit energy-producing provinces (Chart A2-1). In comparison, growth in hourly compensation measured in the PA decelerated to almost 0% in the first quarter of 2016. Similarly, as the economy recovered last year, the LFS wage growth lagged the recovery in underlying wage pressure. In recent quarters, it has instead overshot other wage growth measures, such as the SEPH and the NAC, by a wide margin. But given the LFS is also the timeliest source of wage growth data in Canada, it tends to be the focal point for economic and financial analysts.[5]
To see through this volatility, the Bank of Canada developed a measure of domestic wage pressures, the wage common (Brouillette, Lachaine & Vincent, 2018). Using a dynamic factor model, the BoC extracts the first unobserved factor explaining the covariance between the four observed wage growth measures. It is assumed that the first factor represents the “true” underlying wage pressure in the economy.[6] Another important characteristic of the factor model is its attribution of smaller weights to wage growth measures that contribute less to the underlying covariances e.g. have a higher unique factor. Hence, a smaller weight is given to the LFS and the SEPH relative to the NAC and the PA, with the latter two being released every quarter but much later than the former two. Therefore, as data becomes available, wage common can be updated to reflect every (weighted) new piece of information.[7] The most recent BoC wage common was 2.3% in the fourth quarter of 2017. In a more recent research paper based on partial data at the time, the BoC also estimated wage common to be slightly below 3.0% in the first quarter of 2018; “the level consistent with an economy that has no labour slack”. Since then, data with bigger weights in the wage common have been released, namely the NAC and PA for the first quarter, and the SEPH for March and April.

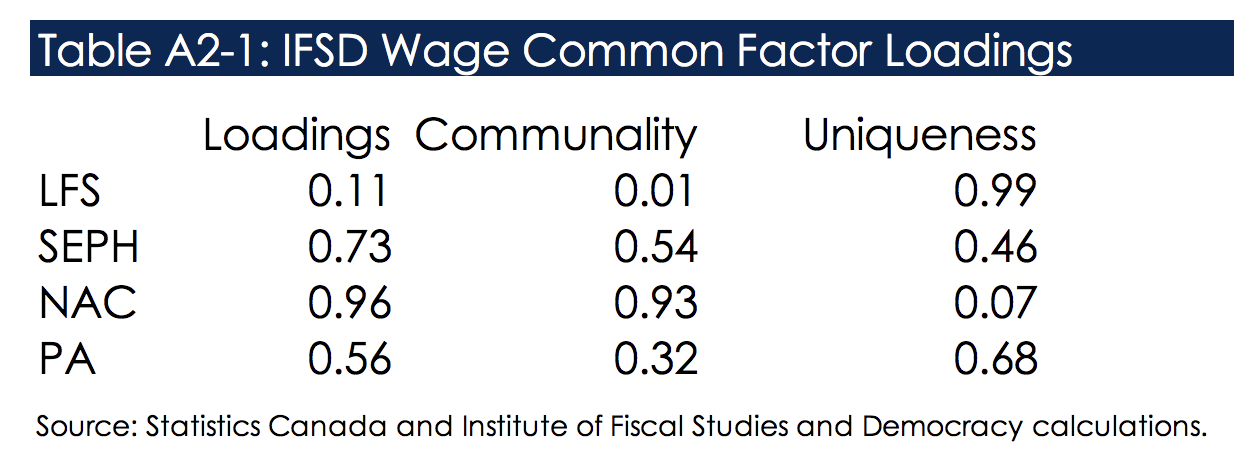
To provide a timely approximation of wage common, the IFSD developed its own estimate of underlying wage pressure using a factor model. Because of differences in the model inputs, specification and estimation procedures, the IFSD wage common will generally differ somewhat from the BoC wage common.[8] Nonetheless, the relative weights put on each wage growth measure is similar between both wage commons, with discounted importance given to the LFS and more importance given to the NAC (Table A2-1).
As a result, the overall trend in underlying wage pressure is very similar throughout the sample period. In the first and second quarter of 2018, the IFSD wage common was stable at 2.4%, somewhat lower than the above-mentioned latest estimate of the BoC wage common. This is easily explained by the fact the NAC and PA wage growth, subsequently released, both slowed down in the first quarter to 1.9% an 2.1% respectively. Finally, if one would use the IFSD wage common to forecast the BoC wage common, wage pressures would be stable at 2.5% in both the first and second quarter of 2018. This represents wage gain acceleration from levels below 2% in late 2016 and an improvement from the fourth quarter of 2017.
[1] A provincial breakdown of the JØLTS is also available in Annex 1.
[2] In the second quarter of 2018, the quit rate was also very low at 0.2%.
[3] 36% of firms also reported a fully utilized labour force as their main obstacle to meet demand––a record-high percentage since 2004.
[4] See Annex 2 for a more complete description of the wage common.
[5] Followed respectively by the SEPH, the NAC and the PA.
[6] For a full description of the methodology, see Brouillette, Lachaine & Vincent (2018).
[7] The dynamic specification of the BoC wage common also includes past quarter’s factor in the current quarter wage common.
[8] Some notable differences are:
(1) The BoC wage common is a dynamic factor model while the IFSD wage common is static. The IFSD wage common still includes a dynamic feature because non-available data for the current quarter are forecasted using simple auto-regressive models. This aims to include a forecast of wage pressures for the current quarter. (2) Growth in hourly wages and salaries from NAC and hourly wage growth from SEPH (two of the inputs) are constructed and therefore vary somewhat between the BoC and IFSD wage common. (3) The BoC dynamic factor model is estimated in a state-space framework using the Kalman filter while the IFSD factor model is estimated using maximum likelihood.