by Jay Zhao-Murray
An accurate measurement of the labour market is essential for making useful macroeconomic forecasts. Even the best models are only as good as the input data––as the saying goes, garbage in, garbage out. Statistics Canada has two programs to measure employment levels and trends: the Labour Force Survey (LFS) and the Survey of Employment, Payroll and Hours (SEPH). In the private sector, Automatic Data Processing, Inc. (ADP) publishes a report—the ADP Canada National Employment Report (NER)—that seeks to align with the SEPH. The ADP NER is relatively new to Canada and is not followed as closely as the LFS or the SEPH, but its timeliness is a plus. In contrast, the SEPH is the most delayed measure, but because of the nature of its underlying data, it provides very useful insights into short-term dynamics of the economy.
The purpose of this note is to describe in greater detail the three aforementioned labour market measurement programs in Canada and examine if and how the ADP NER can be of use to economic forecasters, particularly as an advanced measure of the SEPH.
Labour Force Survey (LFS)
Originally created in 1945, the LFS is the first timely measure of the Canadian labour market, surveying approximately 54,000 households across Canada every month. It was redesigned in 1976 and 1997. The survey is used to measure, among others, the unemployment rate, the participation rate, and the employment-to-population ratio, categorized by age, sex, location, and industry. The data are collected during the third week of every month and released early the following month. Results are used to determine eligibility and benefits for Employment Insurance, are factored into the calculation of Gross Domestic Product (GDP), and are monitored closely by the Bank of Canada to set monetary policy.
Survey of Employment, Payroll and Hours (SEPH)
The SEPH provides more detailed information than the LFS on the total number of paid employees, hours worked, job vacancies, and wages at the industrial level, although it uses a narrower definition of employment (i.e. excluding self-employment and agriculture)[1] This information is included in official measures of Gross Domestic Product by industry. The target population of the survey includes all businesses in Canada with at least one paid employee receiving a T4 slip. The data are quite delayed, typically being released two months after the reference month, and undergo periodic revisions.
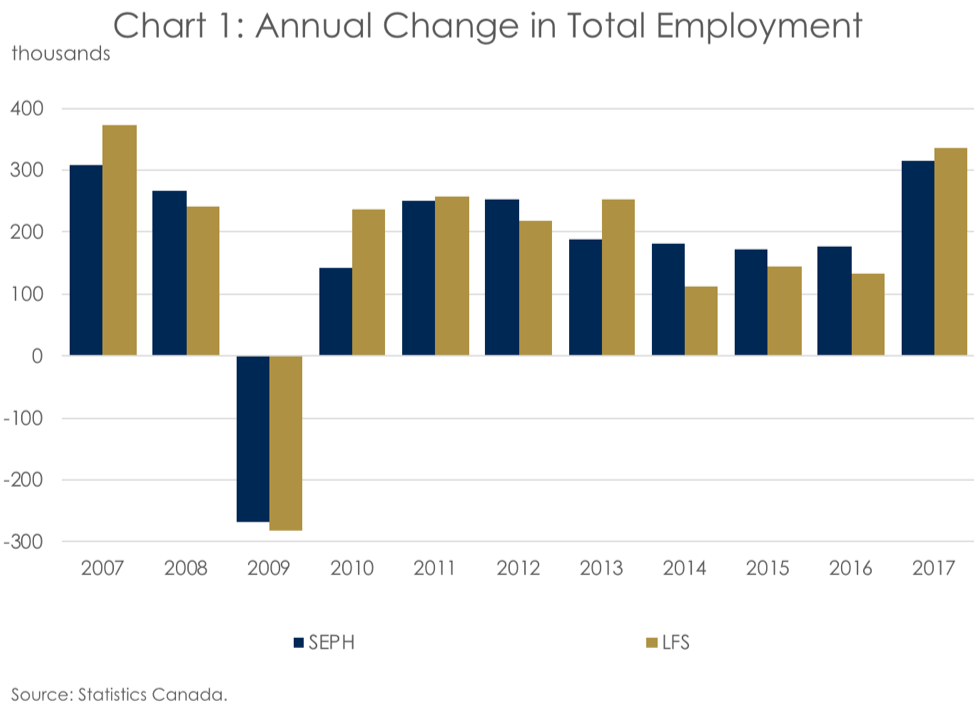
The first Canadian payroll employment survey dates back to 1918, although the SEPH has been altered many times over the years. In 1993, the SEPH began incorporating administrative data collected by the Canada Revenue Agency to determine the level of employment. Over the long term, the SEPH and the LFS track well (Chart 1), although there can be significant discrepancies in the short run. Continuous series from Statistics Canada are available as early as 2001 for the SEPH, whereas the LFS data go back to 1976.

ADP Canada National Employment Report (NER)
ADP is a multinational corporation that provides businesses with human resources management software and services. Based on its payroll data of companies using ADP software, it publishes a monthly employment report, the aforementioned NER. In Canada, the NER was first released in November 2017, using data beginning in 2012.[2] According to the ADP White Paper, the report’s intended goal is to track the SEPH, measuring the monthly change in non-farm payroll employment.
The NER is released shortly after the LFS, with each month’s data being revised once with the following month’s report. The earliest measure of the NER is called the two-period-ahead model, as it is released almost one and a half months ahead of the latest SEPH numbers, while the revised NER for the previous month is called the one-period-ahead model. In practice, with every new press release, the two-period-ahead model from the previous month is revised and becomes the current one-period-ahead model.
Which Measure of the Labour Market Is a Better Predictor of the SEPH?
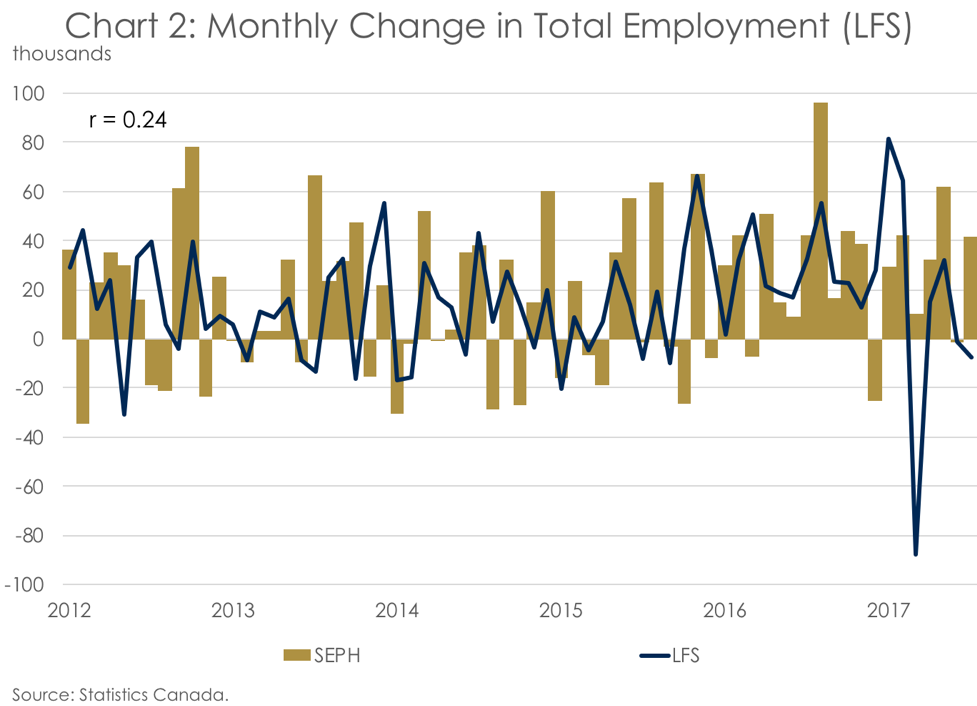
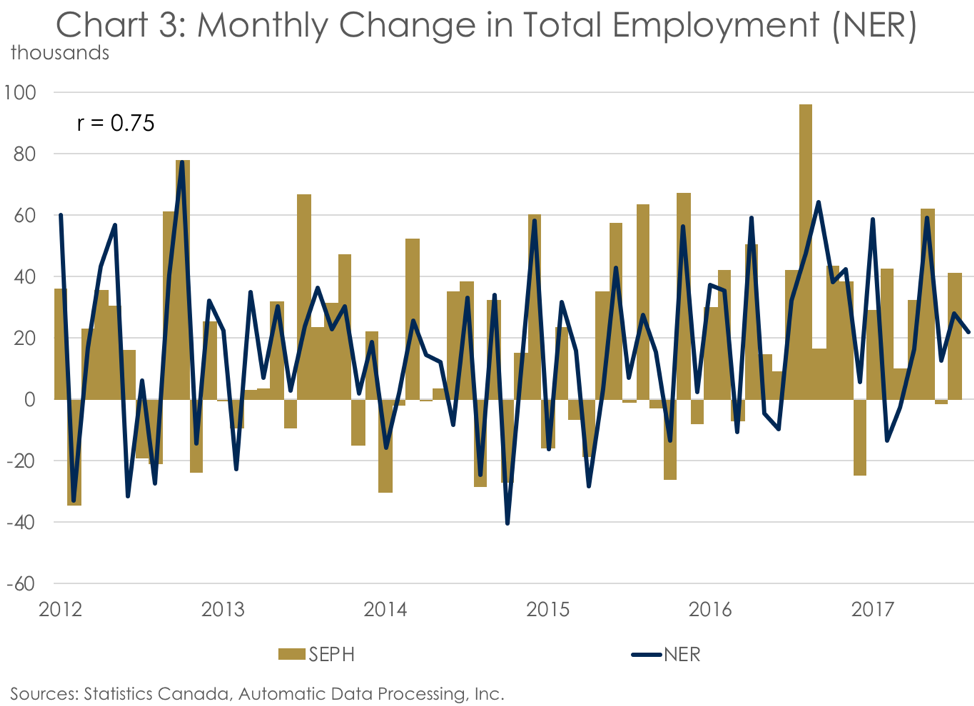
Although the LFS and the SEPH demonstrate very similar trends over the course of several years, they differ significantly month-over-month (Charts 2). On the contrary, the data suggest that the one-period-ahead NER tracks the SEPH quite accurately over the short run (Chart 3). As data from the NER are revised one month after originally being published, the earliest NER with reliable data for May would be published in July. However, an advantage of using the ADP NER is that the data are only revised once, making the one-period-ahead model the de facto final estimate.


How Correlated Are the Different Measures of the Labour Market?
The LFS and NER both use different, more highly aggregated industrial measures than the SEPH. We see a strong positive linear relationship (r = 0.75) between the revised SEPH and the one-period-ahead NER when comparing total change in employment month-over-month, although certain industries show stronger correlations than others. The industries for which the NER best predicts the SEPH are healthcare, trade, transportation, and utilities (Table 1). In contrast, there appears to be a weak correlation between the SEPH and the LFS (r = 0.24), with certain industries even showing a slightly negative relationship (Table 2). Moreover, the weak correlation between the LFS and the SEPH cannot simply be explained by the different measures of employment. Statistics Canada’s own adjusted LFS series, created by subtracting, among others, agriculture, fishing, and hunting from total employment, shows a weaker correlation with the SEPH than the unadjusted LFS in month-over-month employment change.
The NER numbers are promising, but the revised SEPH figures can differ from their historical real-time releases (vintages). We verified the correlation between the one-month ahead NER and SEPH vintages, finding that it was weaker than when using revised data (r = 0.70, Chart 4). Nonetheless, at 70%, the one-month-ahead NER model can still be used as a useful tool to forecast the change in SEPH employment in real time, providing insight into current economic activity.[3]


What’s the Key Takeaway?
The Labour Force Survey and the Survey of Employment, Payroll and Hours––the official Statistics Canada measures of the labour force––display very similar trends over the years but can differ greatly month-to-month. The ADP Canada National Employment Report provides an advanced estimate of the SEPH, but it is only reliable after the first revision. Moreover, with a smaller sample size, the correlation between the ADP NER and the SEPH is slightly weaker when using real-time SEPH data.
These findings could be of interest to economic forecasters, as the SEPH is a useful input into the short-term economic outlook. Furthermore, according to Bloomberg, the ADP’s U.S. Employment Report is used by the Federal Reserve to capture a better picture of national employment. However, as it only measures one fifth of the labour market, it has “confounded analysts who’ve tried to use it to build a reliable proxy” for official payroll data from the Bureau of Labor Statistics.
The Institute of Fiscal Studies and Democracy (IFSD) created Nowcast Canada, a forecast of the very near-term Canadian economy carried by Bloomberg. Nowcast Canada provides real-time estimates of GDP growth. It uses SEPH employment indicators as inputs into its projections for the output of several services industries (e.g., finance and insurance, public administration, accommodation and food services, etc.). The ADP NER could provide advanced information on the short-term economic outlook before the SEPH is even released. The IFSD is currently considering adjusting the Nowcast model to include this new data.
[1] In 2017, 15.2% of workers across all industries were self-employed. Agriculture comprised 1.5% of all workers, 60% of which were self-employed.
[2] ADP has published a similar report in the U.S. since 2006.
[3] Real-time historical releases of SEPH (vintages) are only available starting in January 2015, so the correlation is based on a smaller sample. As mentioned above, the first ADP NER was released in November 2017, although the data goes back to 2012. As such, we cannot verify the number of revisions to the data prior to November 2017.


