
by Dominique Lapointe
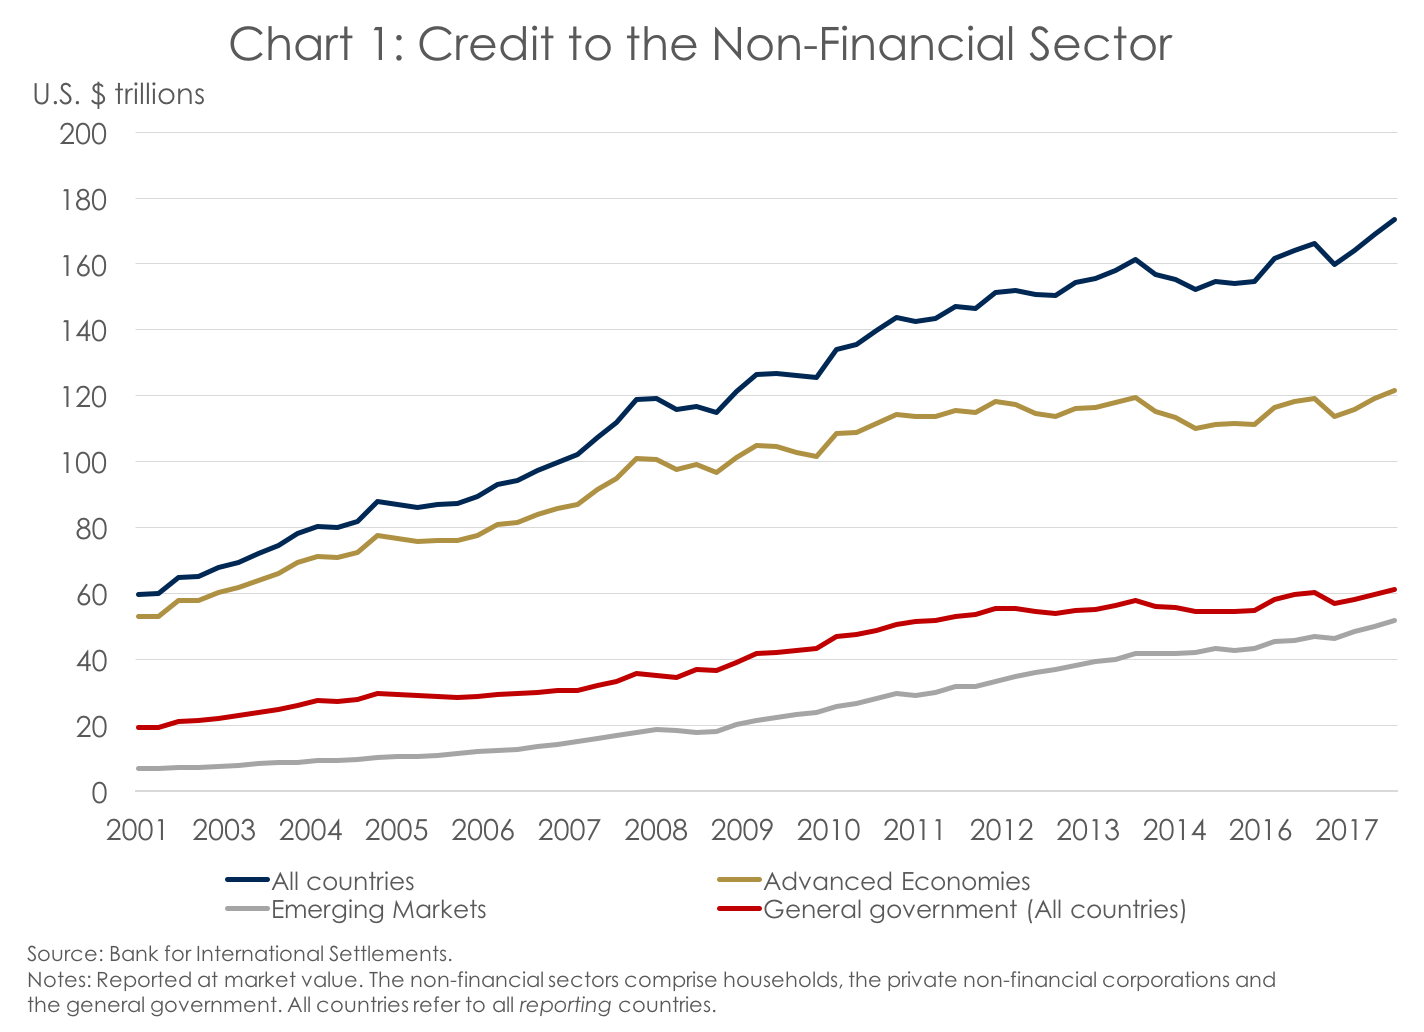
On April 9, 2018, the Institute of International Finance (IIF) reported that global debt reached $US237 trillion at the end of last year, a $US21 trillion increase from the end of 2016. Narrowing this gigantic measure to countries reporting to the Bank for International Settlements (BIS), total credit extended to the non-financial sector was more than $US173 trillion (Chart 1) in the fourth quarter of 2017.[1] Of that “core debt,” $US122 trillion (70%) was outstanding in what are usually called “advanced economies”. Also, $US61 trillion (35%) was owed by general governments.[2] The latter is almost double what it was just a decade ago. Since the BIS does not include insurance and pension liabilities and other accounts payable by governments in its measure of “core,” $122 trillion only represents a partial picture of public liabilities.
Assessing the importance of numbers in the hundreds of trillions can be overwhelming. “What does it even mean?” In Canada, with gross public debt worth nearly two trillion dollars, the question remains valid.[3] In our opinion, any assessment of public debt needs to be put 1) in the context of its own economy to determine how sustainable it is and 2) in an international context.
Using the federal government as a case study, we first deconstruct Canada’s debt. It is only then that we are able to compare it meaningfully to that of other countries, and to assess its sustainability.
What do we mean by debt?
Akin to that of a giant corporation, the government’s balance sheet can be broken down into assets and liabilities from which various debt measures commonly used are derived.[4] The broadest measure of debt in Canada is “gross” debt, which includes all outstanding liabilities. At the end of the 2016-17 fiscal year (the last year for which audited financial statements are available), gross debt amounted to $1,097 billion ($1.1 trillion) (Chart 2). The government expects gross debt to reach $1,162 billion at the end of this year.
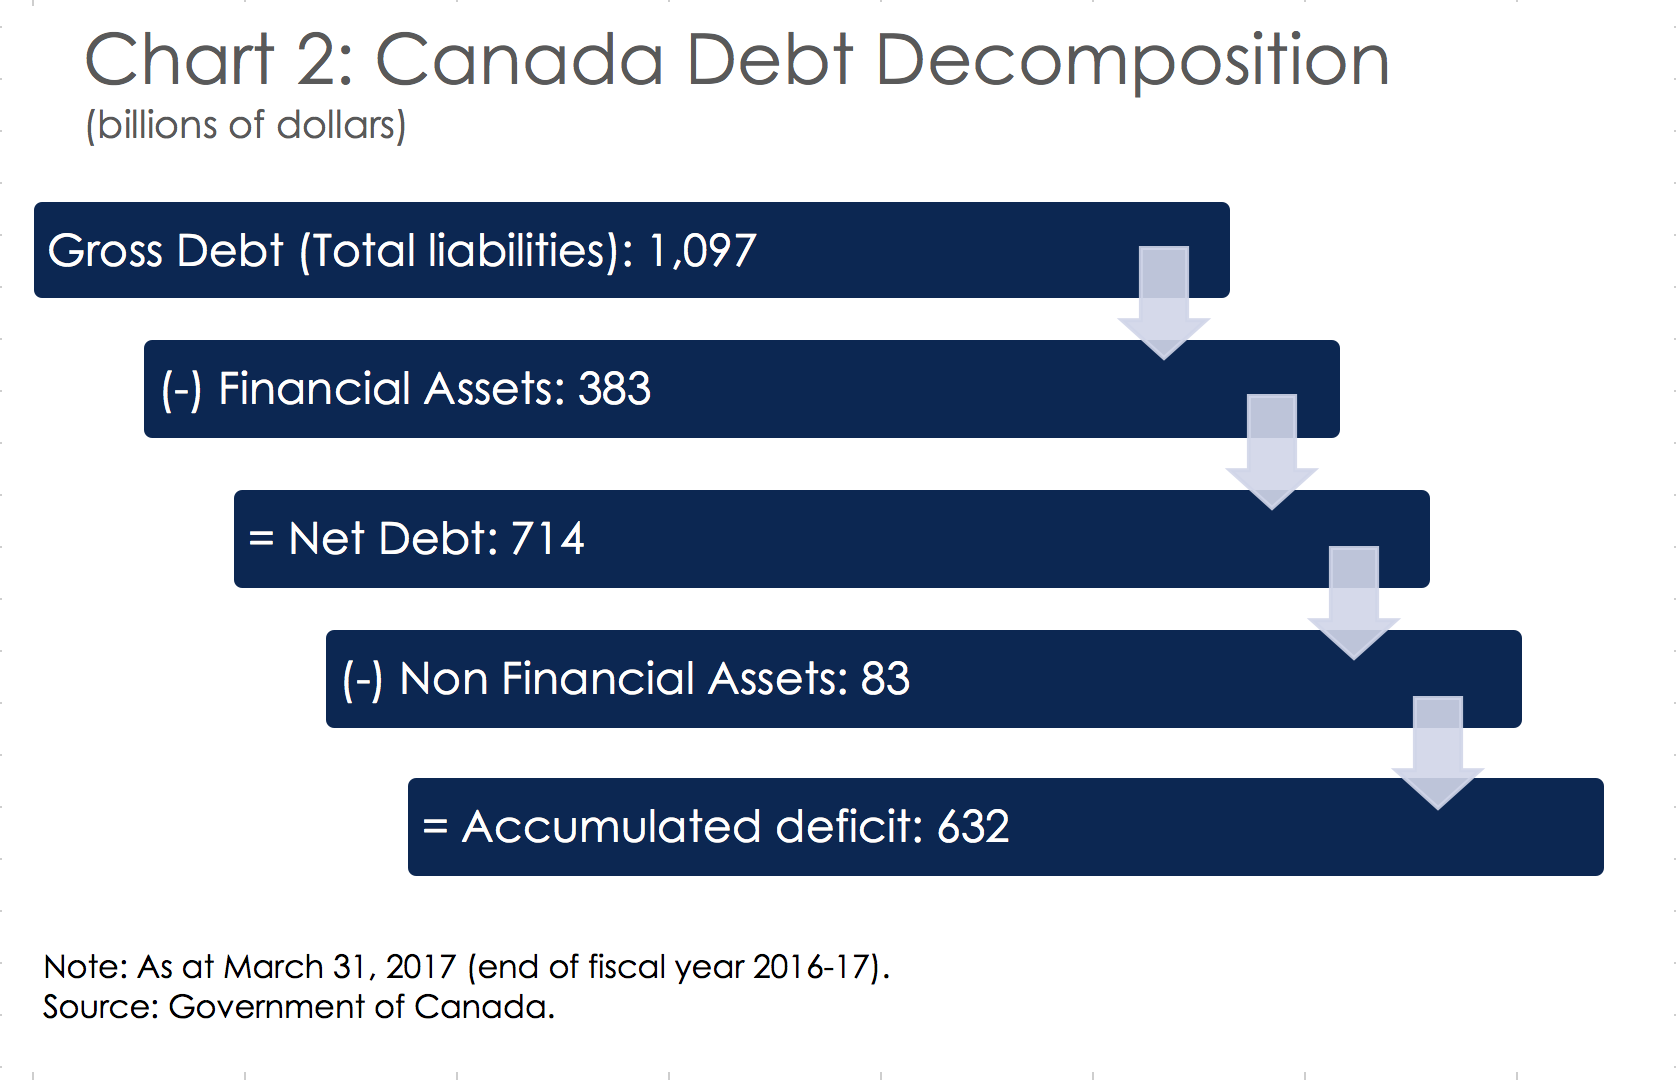
Then, to obtain net debt, financial assets are removed. The rationale is that, in theory, financial assets could be used to pay back debt, should the need arise. The Government of Canada’s financial assets are mainly composed of taxes receivable (29%), investment in enterprise Crown corporations (26%), foreign exchange accounts (26%), and cash and/or cash equivalents (10%). Finally, removing non-financial assets––mainly composed of tangible capital assets (81%), inventories (8%), and prepaid expenses and other (7%)––renders the accumulated deficits. Put differently, assuming full restatement or no major changes in accounting practices, the sum of every fiscal year’s budgetary balance (surplus or deficit) since inception would equal the current accumulated deficit (or surplus).
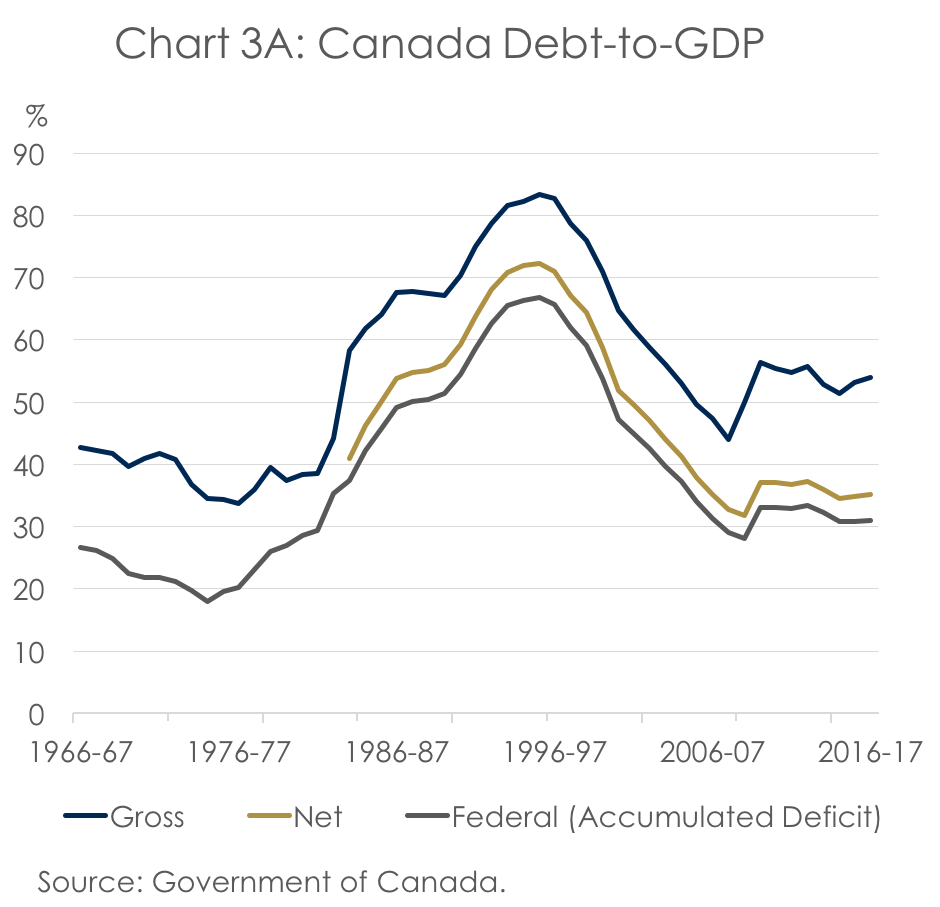
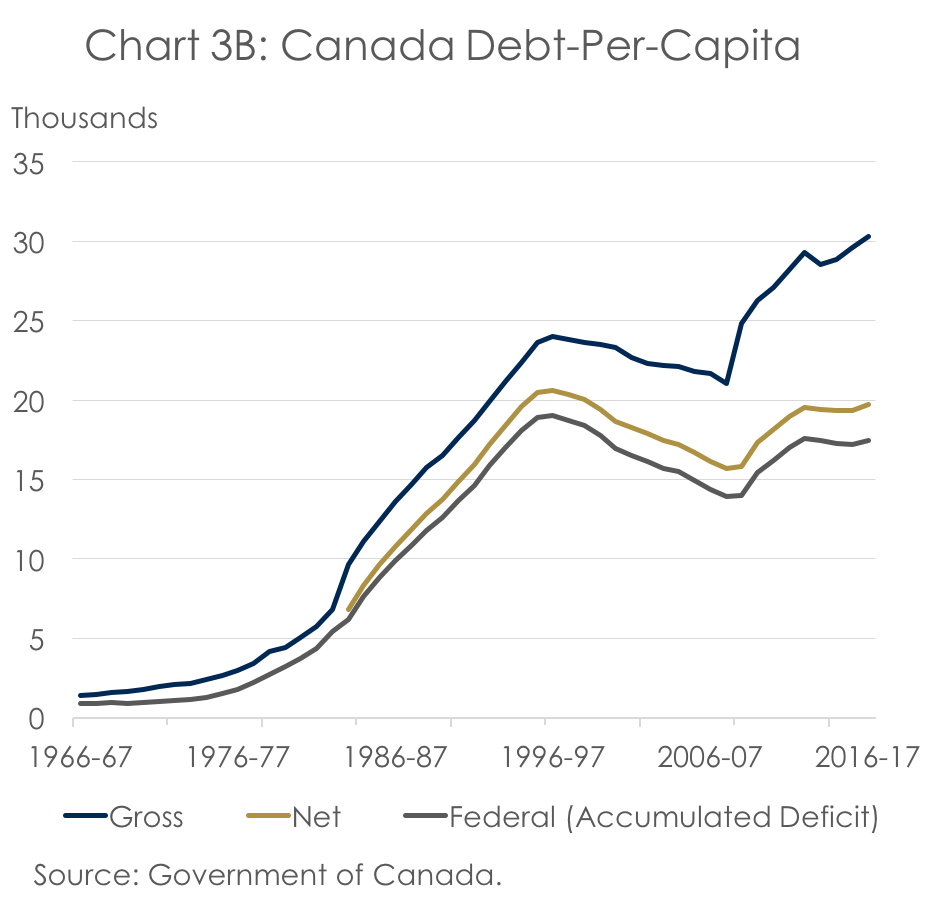
To gauge the weight of each of those debt measures, it is useful to place them against the government’s capacity to generate revenue, approximated by nominal GDP (Chart 3A). After reaching a 25-year low in 2007, gross debt-to-GDP increased by 12.4 percentage points in a matter of only two years due the 2009 recession and the deficits that ensued, reaching 56% in 2010. Since then, gross debt-to-GDP has trended gently lower. But, the three indebtedness ratios are still significantly above their pre-recession low. In dollar terms, gross debt per capita reached a record level of $30,000 in March 2017 (Chart 3B). The accumulated deficit was approximately $17,000 per person.
Another useful way to break down the government’s balance sheet is by separating liabilities that bear interest from those which do not (Chart 4). The vast majority (88%) of Canada’s debt bears interest and is divided between market debt, or debt that is securitized (74%), and pension and other future benefits and liabilities (26%). Market debt results from budgetary transactions, the debt incurred to finance accumulated deficits, and non-budgetary transactions like tangible capital assets and inventories.[5] The choice of which security to use to finance market debt pertains to the Debt Management Strategy. Several variables that aim to balance the costs and risks (volatility) of debt payments, as well as financial market imperatives, are taken into account when elaborating the Debt Management Strategy[6]. Finally, pension and other future benefits––owed in majority to public sector employees, the Canadian forces, and the RCMP––also bear interest.
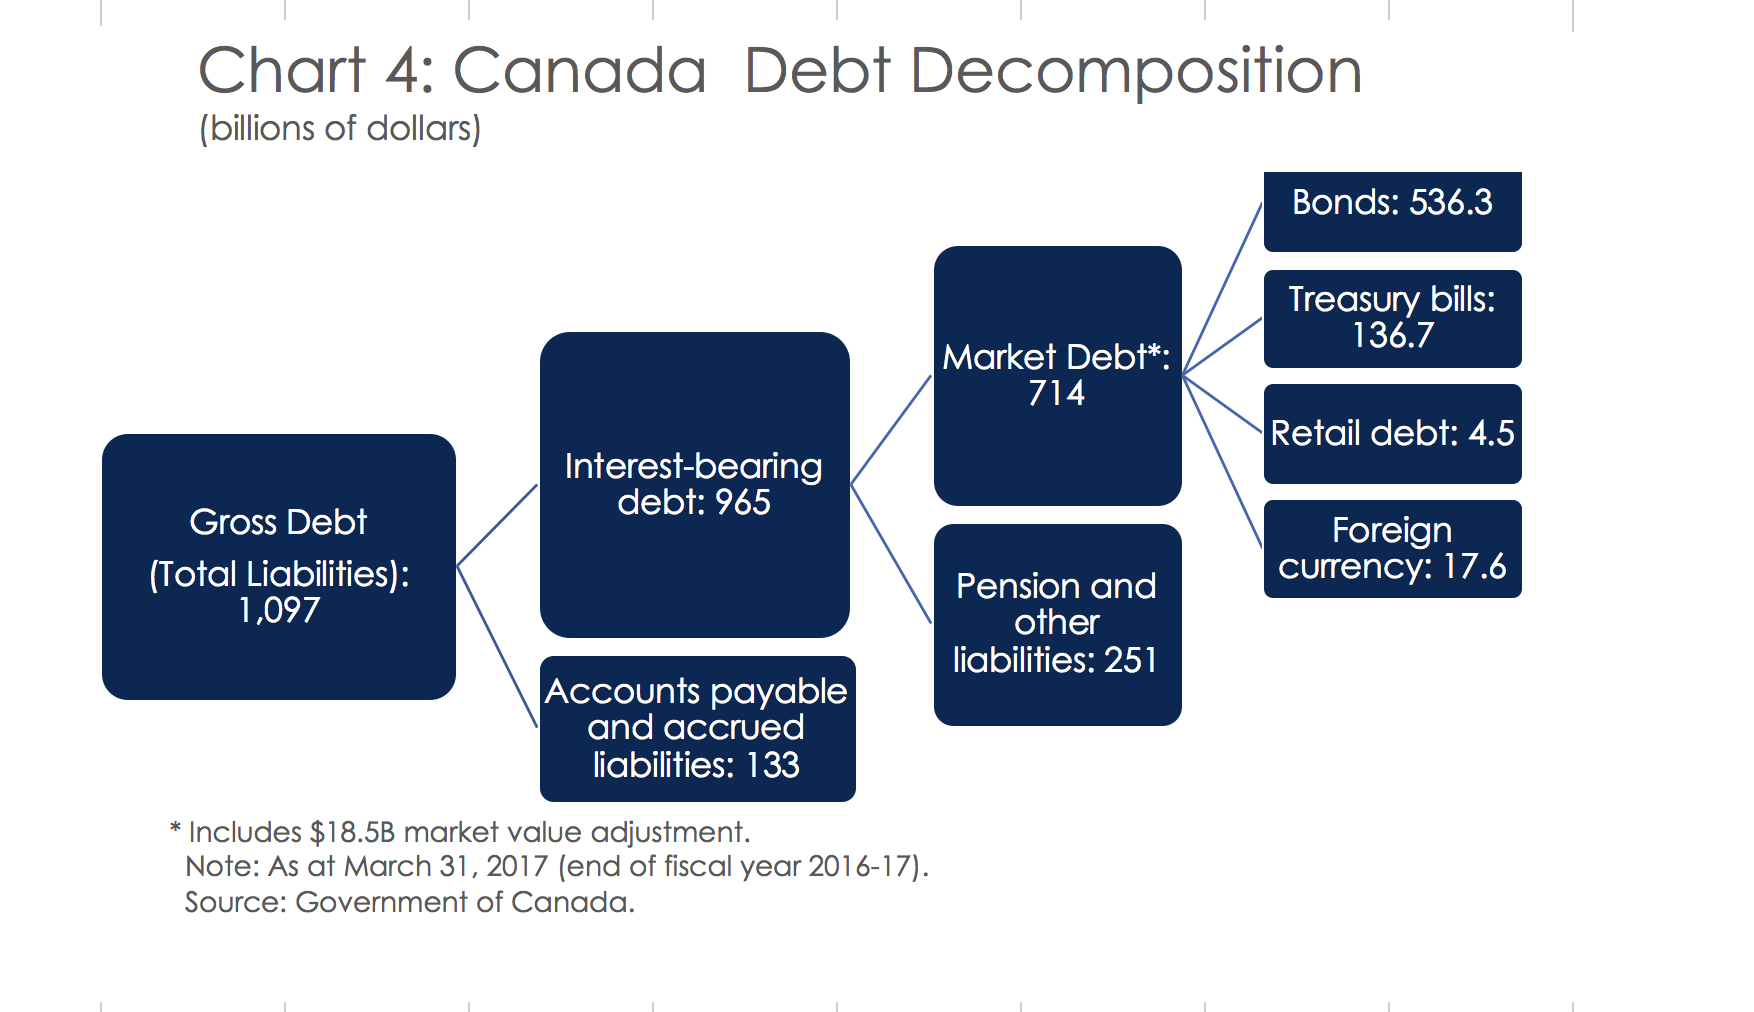
While the breakdown of debt presented in Chart 2 is fairly consistent across jurisdictions, the decomposition by types of liabilities in Chart 4 will vary substantially depending on the jurisdiction’s specific responsibilities and ways by which it finances itself. For instance, the Province of Ontario will include other long-term financing as a liability on its balance sheet resulting from the consolidation of its broad public-sector organizations. As well, in Ontario, funds received from the Federal government that represent unamortized portions of tangible capital assets or liabilities to acquire tangible capital assets are recorded as a liability.[7] Another example would be in Quebec: the Fonds des Générations, akin to a sovereign wealth fund, is recorded as a financial asset on the balance sheet.[8] There is no such comparable fund at the federal level.
How big is this?
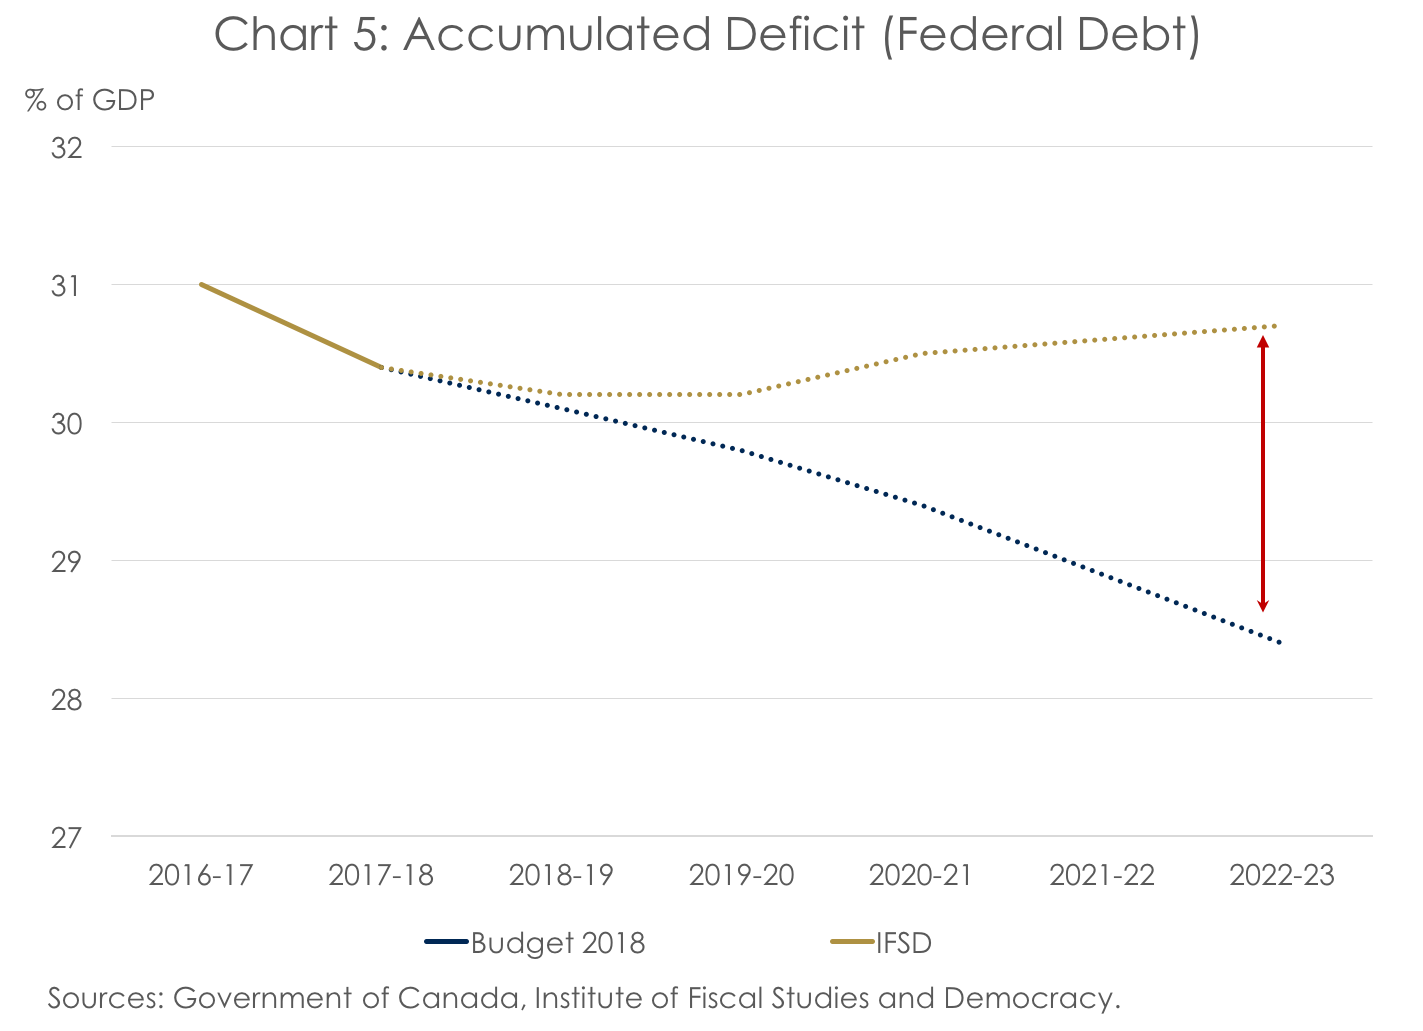
As mentioned above, it is difficult to assess the importance of such numbers without putting it relative to the economy’s broad capacity to generate revenue e.g. nominal GDP. Henceforth, at the end of the current fiscal year (2018-19), the Institute of Fiscal Studies and Democracy (IFSD) forecasts that the federal government’s accumulated deficit (federal debt) will reach $672 billion, representing 30.2% of nominal GDP. Because of different fiscal forecast assumptions, that ratio is a tad higher than the 30.1% expected by the Government in its latest Budget. However, as those fiscal forecast differences compound, the federal debt-to-GDP forecast discrepancy increases over time (Chart 5). This also needs to put in perspective:
- The IFSD’s forecasted increase in the federal debt-to-GDP is smaller than 1 percentage point (from 30.4% in 2017-18 to 30.7% in 2022-23); and
- Using net debt, the IFSD concluded in its inaugural Fiscal Sustainability Report that Canada’s debt, in the long-run, is sustainable. This means that, in a matter of decades, the federal government’s net debt-to-GDP will eventually decline.
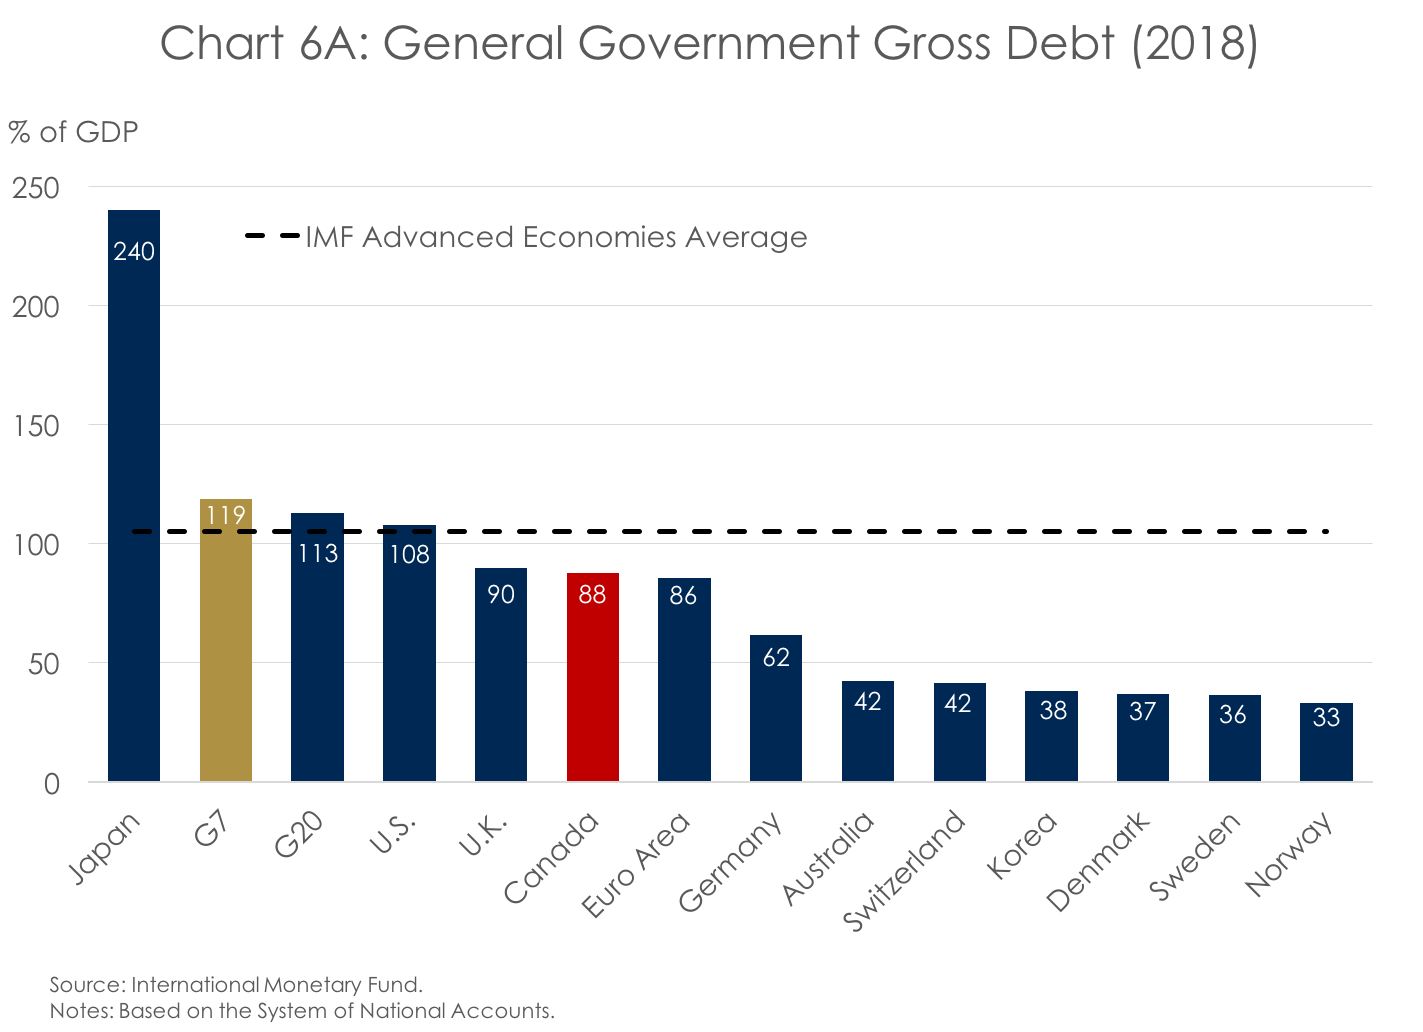
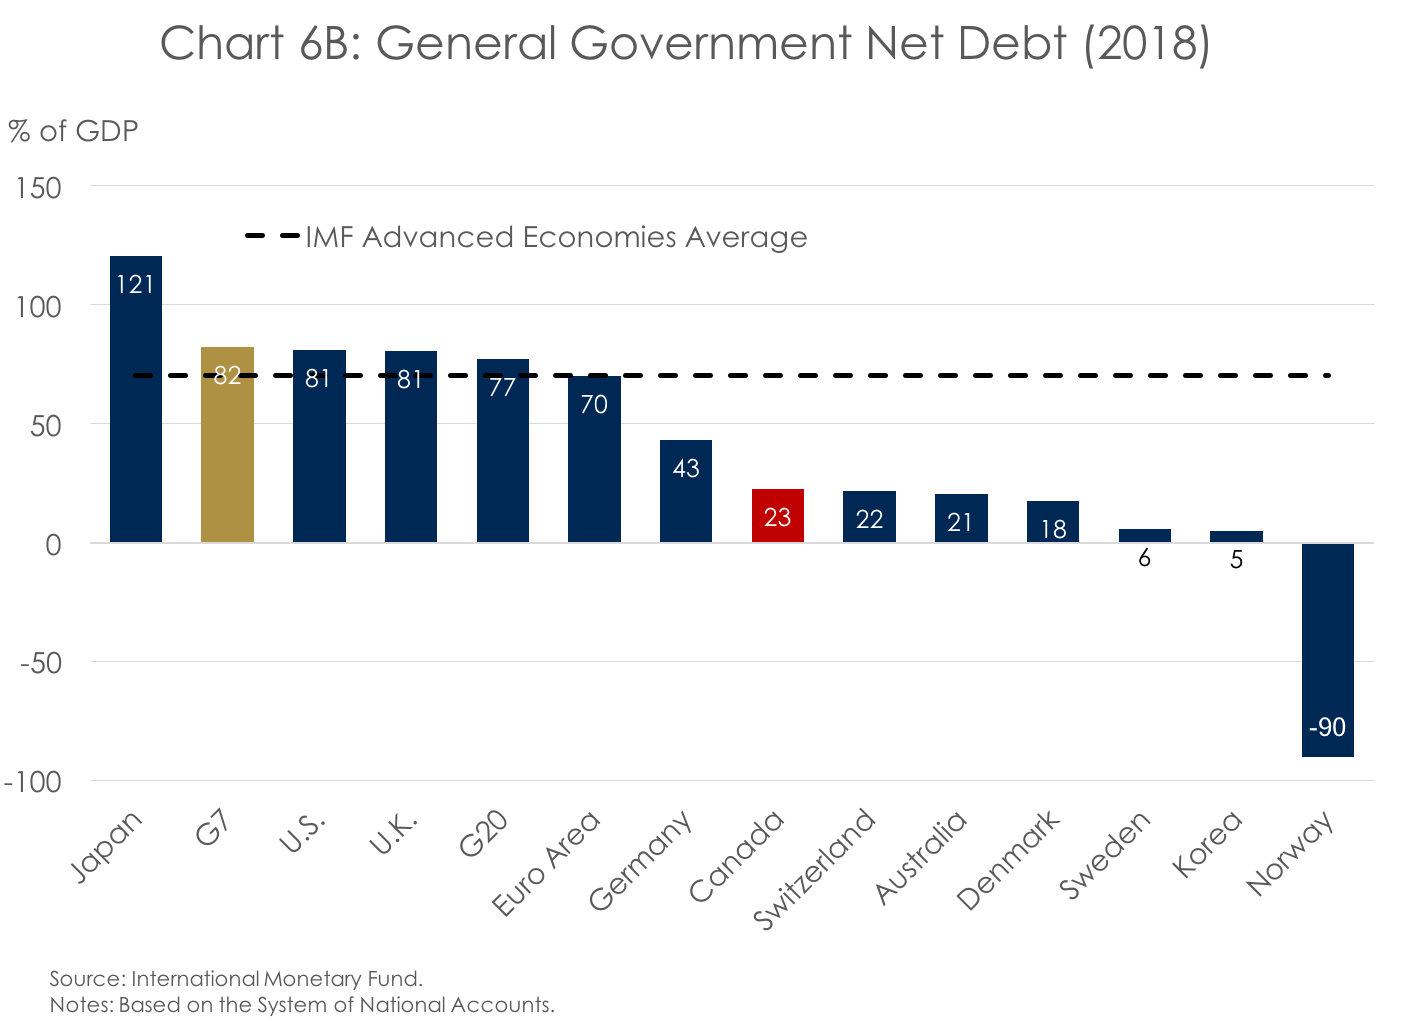
Next, we compare Canada’s debt to other countries. For the comparison to be significant, the concept of General Government is used. It includes subnational (provincial and territorial) debt as well as local (municipalities) debt. First, at 88%, Canada’s general government gross debt ratio ranks below the IMF, the G7, and the G20’s averages (Chart 6A). It has a similar debt ratio to the Euro Area as a whole, though it is significantly higher than Germany’s, the Area’s largest economy. Still, the IMF is of the opinion that debt assessment should be made both on a gross and on a net basis.[9] Indeed, some countries might own significant financial assets while others do not. This should be taken into account when comparing debt burden. Ratings agencies also use a modified version of net debt in order to assess credit risks pertaining to long-term debt securities and to attribute sovereign credit ratings.[10] Besides, work on fiscal sustainability in the Canadian context done by the Parliamentary Budget Officer, the Financial Accountability Officer of Ontario, and the IFSD also use net debt. Based on a selected sample of advanced economies, Canada exhibits lower net debt-to-GDP than the IMF’s advanced economy average––and by a wide margin (Chart 6B). Notably, at 22.7% expected in 2018, the jurisdictions of Canada benefit from lower net debt-to-GDP than long-time partners and allies like the United States and the United Kingdom, at 81.1% and 80.6% respectively. On the other hand, public debt in Canada is similar to Commonwealth partner Australia and significantly higher than most Scandinavian countries.
In conclusion
Looking at debt numbers from a dollar value perspective can be mindboggling. Moreover, the various debt measures that are used and the virtually infinite decomposition of liabilities that can be done make it hard to interpret a country’s relative indebtedness. Canada, as a more or less decentralized federation including provinces, territories, and various municipalities and local governments is no stranger to those issues. Focusing on the federal government’s debt ratio, the IFSD is of the opinion that it will slightly grow over the next five years but remain much lower than most other advanced economies. While fiscal sustainability analysis indicates that the federal fiscal structure is sustainable, challenges still lie ahead. As global interest rates have started to rise in the last year, and are likely to continue to do so, the proportion of budgetary revenues dedicated to servicing the debt will rise. Those amounts will hardly be trivial. In fact, the Government of Canada anticipates that total public debt charges (PDC) will increase at an average annual rate of 6.3% over the next five years. That is more than double the average annual rate of 2.8% increase in program expenses. Put differently, the cumulative increase in PDC from 2017-18 to 2022-23 is $9 billion, with upside risks. This is approximately twice the $4.8 billion additional investments in First Nations communities that was announced in Budget 2018. In that context, prudent fiscal management remains, and always is, warranted.
[1] For all reporting countries. Includes a selection of 11 advanced economies including the Euro Area and a selection of 21 emerging markets economies. That selection covers the majority of global output. Please see BIS Table F1.2 for the full list.
[2] “General government” includes the central government and subnational governments like states and provinces as well as local governments and municipalities.
[3] Refers to general government gross debt estimated by the International Monetary Fund World Economic Outlook (October 2017).
[4] In the public accounts, the government’s balance sheet is called the Statement of Financial Position. For readers familiar with the fundamental accounting identity (Assets = Liabilities + Shareholder’s equity), one major difference between public and private accounting is that businesses in “normal” circumstances do not carry negative equity (Assets – Liabilities). The government, with potentially unlimited ways to generate revenue, often carries negative equity, which amounts to the accumulated deficit (Total Assets – Total Liabilities).
[5] See Table A2.9 and Table A3.1 of Budget 2018 for more details on financial sources (requirements).
[6] More information on the Debt Management Strategy can be found in Annex 3 of Budget 2018 as well as in the latest Debt Management Report published by the Government of Canada. The IFSD’s forecast and analysis of the 2018-19 Debt Management Strategy are also available.
[7] See the 2016-17 Annual Report and Consolidated Financial Statements of Ontario for more details.
[8] See the 2016-17 Comptes publics (Volume 1) du Québec for more details.
[9] See Appendix 3 of the IMF September 2011 Fiscal Monitor for more details.
[10] On the other hand, the liquidity of financial assets––and therefore their relative usefulness in offsetting liabilities––is questionable. For that reason, institutions usually consider the most liquid subset of financial assets. For example, see S&P Global Sovereign Ratings Criteria.