
by Randall Bartlett and Fanny McKellips
Back in March, we published a blog post about @NowcastCanada, the Institute of Fiscal Studies and Democracy’s (IFSD’s) nowcast of real GDP growth, as well as the IFSD’s nowcast of the unemployment rate. Our full report on forecasting the unemployment rate using a Google index is now available on our website. See the updated blog post below for more information.
Along with continued advances in computing power and the availability of a broader range of data than just that provided by official sources, nowcasting has become an increasingly popular area of analysis among economists. Also known as tracking or monitoring, nowcasting refers to forecasting an economic variable in the very near term by incorporating data of varying frequencies or timeliness, as well as data from official and unofficial sources.
Nowcasting is nothing new. Analysts have been doing this work for decades. Instead, what is new is the greater accessibility of both modelling tools and data, as well as how public the results of this analysis have become. Take, for instance, the GDPNow model published by the Federal Reserve Bank of Atlanta, which has become a touchstone for many investors looking for insight on the state of the U.S. economy. In 2016, the Federal Reserve Bank of New York also got into the nowcasting game and now regularly publishes its take on U.S. real GDP growth in the current quarter.
In Canada, we are also no stranger to nowcasting. Beyond its frequent publications on the topic (this, for example), the Bank of Canada publishes its nowcast of Canadian real GDP growth every quarter in its Monetary Policy Report. The Parliamentary Budget Officer also regularly publishes its outlook for the most-recent, yet-to-be-released print of GDP. Bay Street analysts do the same (see the Bank of Montreal, for example). And, one would hope, federal and provincial public servants are concocting model-based forecasts of economic activity somewhere behind the scenes, even if it is rarely, if ever, published.
Adding another voice to the Canadian nowcasting landscape is the IFSD’s @NowcastCanada model. Based on an approach similar to that of GDPNow, @NowcastCanada takes two approaches to forecasting real GDP growth: one that builds up every industry and expenditure category based on the input series outlined by Statistics Canada and another that extracts the unobserved series that is most correlated with all of this input data (known as a principal component). The nowcasts are then combined to get a single-point estimate of quarterly real GDP growth that has yet to be released. Recently covered by Kevin Carmichael in Canadian Business, the @NowcastCanada model is updated every time there is a major data release, making it the only public source of up-to-date nowcasts of real GDP growth in Canada.
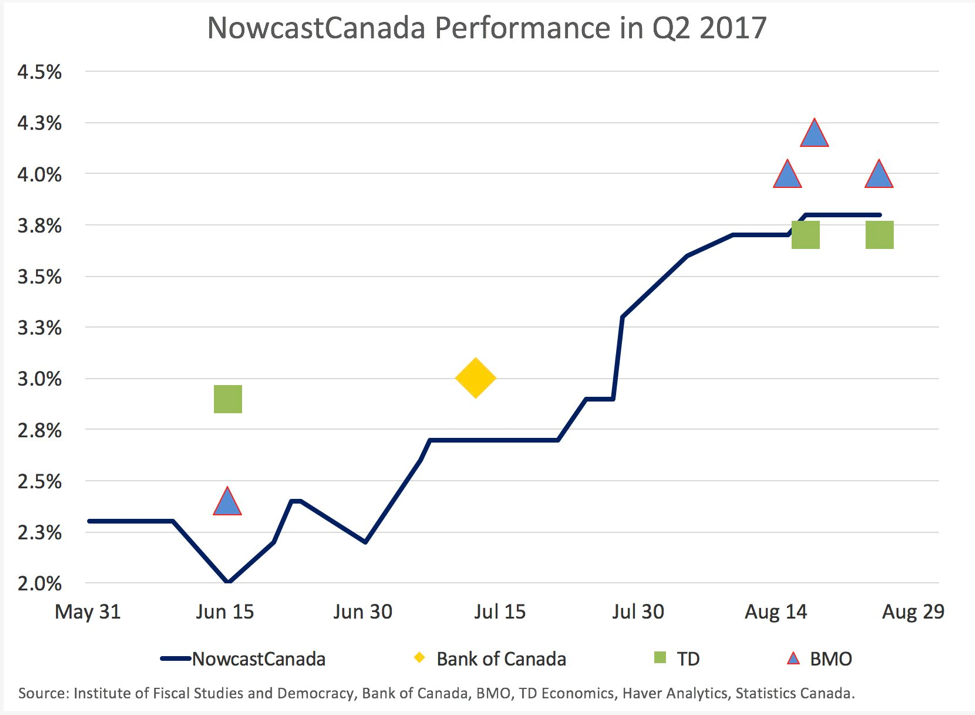
Of course, things don’t always go as planned. @NowcastCanada’s final nowcast of real GDP growth in the second quarter of 2017 missed the mark by a wide margin. At 3.8% q/q annualized, this was well below the 4.5% official outturn. That said, this was a hair closer than consensus, at 3.7%. But it’s important to put this in context. What matters is that the nowcast performs well over time, making this one miss just a single data point of many among many future data points. And, notably, @NowcastCanada closely tracked the Q2 2017 nowcasts of both the Bank of Canada and private-sector forecasters (see chart). That being said, the models underlying @NowcastCanada are constantly being evaluated and revised as need, in order to avoid persistent bias in one direction or the other.
But while nowcasting real GDP growth tends to be among the more popular pastimes of forecasters these days, other economic variables also lend themselves very well to nowcasting. Take, for instance, the Billion Prices Project run out of the MIT Sloan School of Management. According to its website, “the Billion Prices Project is an academic initiative that uses prices collected from hundreds of online retailers around the world on a daily basis to conduct economic research”. This analysis allowed researchers to highlight the runaway Consumer Price Index (CPI) inflation in Argentina (which contradicted the official statistics being published). It also suggests that CPI inflation in the US may be higher than is estimated by the official data used by the Federal Reserve to make monetary policy decisions.
Another economic variable that can be usefully nowcast is the unemployment rate. Often released with very little delay following the end of the reference month, the unemployment rate is one of the first indicators economists, investors, and policymakers get as to the health of an economy. But, given the small amount of time between the collection and dissemination of unemployment data, there is often little, if any, official data available to help in nowcasting the unemployment rate. Instead, researchers have begun using big data in the form of Google Trends to see if search volumes related to support programs tied to recent unemployment are a good predictor of changes in the unemployment rate itself. A great example of this is ETLAnow, a tool developed by The Research Institute of the Finnish Economy, “to use big data in economic forecasting”. ETLAnow uses real-time data from Google Trends and the latest official data from Eurostat to nowcast the upcoming month’s unemployment rate for all countries in the European Union. The same researchers have done similar work for U.S. state-level unemployment rates, with varying degrees of success.
Looking to Canada, Fanny Mckellips, a former uOttawa student and IFSD employee now studing at Queen’s University, worked with me at the IFSD to replicate the ETLAnow methodology for the Canadian unemployment rate (research note is forthcoming). The methodology is relatively straightforward. To begin, a benchmark model is developed which attempts to predict the current period’s unemployment rate based on that of the prior period. This is known as a first-order autoregressive model (AR(1) model). Then, an index based on Google Trends data is added to the model and the model fit and predictive abilities between the new model and the benchmark model are compared.
Unfortunately, the results aren’t particularly promising in the Canadian context. While some specifications lead to the Google index being significant, slight changes in the sample size or search words quickly render the index insignificant. Further, regardless of the level of significance, adding the Google index to the model does little to improve the predictive value relative to the AR(1) model. As such, adding Google Trends data on Employment Insurance (EI) benefit searches does not appear to materially increase the ability of a simple AR(1) model to predict the unemployment rate in Canada. Consequently, both models are currently projecting that the unemployment rate in August 2017 was 6.3%, largely unchanged from the July 2017 level. However, a potentially more fruitful area for future research is looking at the ability of the Google index to help predict turning points in the unemployment rate, a leading indicator of changes in the business cycle. Stay tuned!