by Alex Reeves
Summary:
- Ontario has an unsustainable fiscal structure with significant demographic pressures
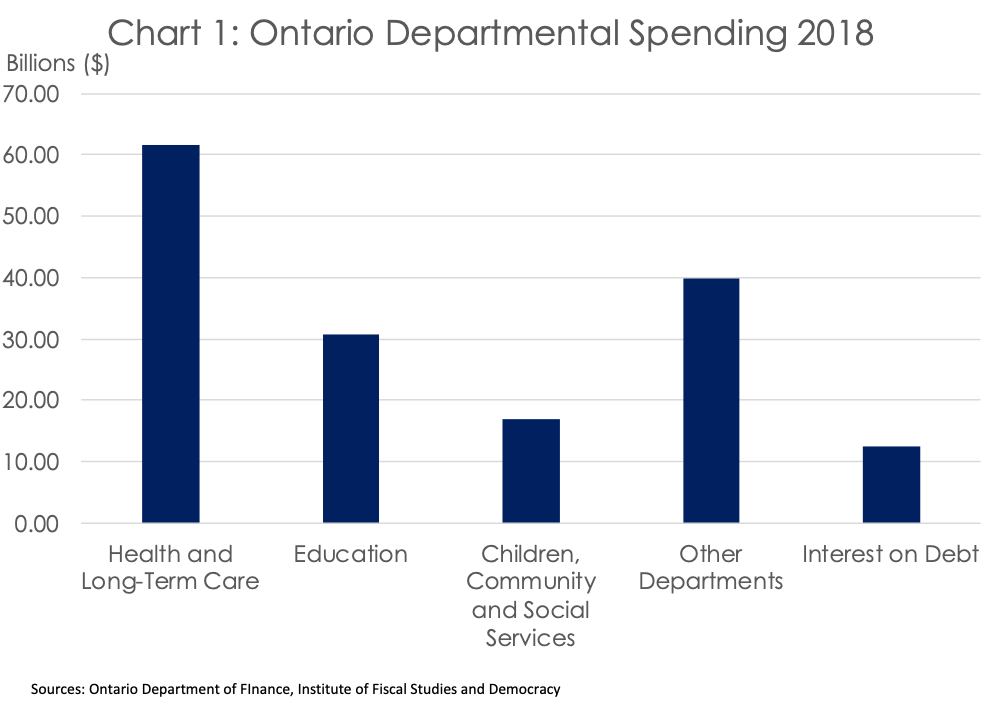
- In Ontario, 70% of the provincial government’s spending is allocated to healthcare, primary and secondary education, and community services.
- It would be difficult for any government to reduce the deficit and cut spending without impacting the Ministry of Health and Long-Term Care, the Ministry of Education and the Ministry of Community and Social Services given that they represent over two-thirds of Ontario’s spending (in the three above-mentioned areas of activity).
- There have been reports and announcements surrounding the government’s plans to reduce the number of teacher positions in Ontario.
- Teachers’ salaries represent a significant portion of the Ministry of Education’s budget. Thus, to decrease spending in the ministry, reducing teacher salaries and class sizes (related to the number of teachers staffed) would be a reliable unit of analysis to model and assess options for expenditure reductions.
- Fiscal analysis of expenditure reductions can be modelled by increasing class sizes to proposed levels and adjusting the number of teachers. In this scenario, our analysis suggests that there would be a reduction of 6,900 teaching positions in Ontario.
- With the reduction in teacher salaries and the increased distribution of secondary costs, it is estimated that up to $900 million in savings are possible in the first full-year of implementation, growing slightly year over year.
- NOTE: This analysis is fiscal in nature; policy considerations are not addressed.
Intro: The Fiscal Angle of policy changes
If the government proposes to increase class size in our education system, it is important that MPs and citizens have access to a range of information including financial information, so that decisions are taken with as many facts on the table as possible. The purpose of this note is focus on potential fiscal savings. It is one factor among many that must be considered by our decision makers and those responsible for holding the government to account. As the Government of Ontario aims to change its fiscal trajectory, we may also wish to remind ourselves that Healthcare, Education, and Community Services account for nearly 70% of government spending. In this regard, it is hard to avoid touching the “Big 3” in any effort to significantly reduce the size of the deficit (Chart 1). The policy choices the government must make to restore fiscal balance in Ontario are tough political decisions.
 In November 2018, the IFSD took an in-depth look at how education spending is structured in Ontario. We found that the $30 billion budget of the Ministry of Education (MoE)––the second largest department in the province–– has historically been increasing at a rate higher than both inflation and average government spending. Due to both its size and its rate of spending growth, the MoE is a logical place to look for cost reduction and efficiency opportunities.
It should be noted that throughout this note the estimates presented are based on the savings that could be rendered after the full implementation of policy changes, and aren’t reflective of a gradual shift, or the possibility of severance. If the government is accurate in its assertion that it can achieve the desired downsizing through only attrition, it may take a number of years for the savings to grow to the estimated (full implementation) level. In contrast, if the government achieves its desired downsizing through layoffs, then there they would see the savings earlier on, but would also have to book a non-recurring increase to spending to account for severance packages.
Back to the Basics: How Is Education Funded?
While the words “from a financial point of view” may precede some of the least enjoyable debates, they are important to consider when discussing the multibillion-dollar government enterprise that is public education. Accordingly, it is difficult to avoid the discussion of financial considerations when such implications are considerable. But, before delving into expenditures levels per student, we have to consider the way education spending grows.
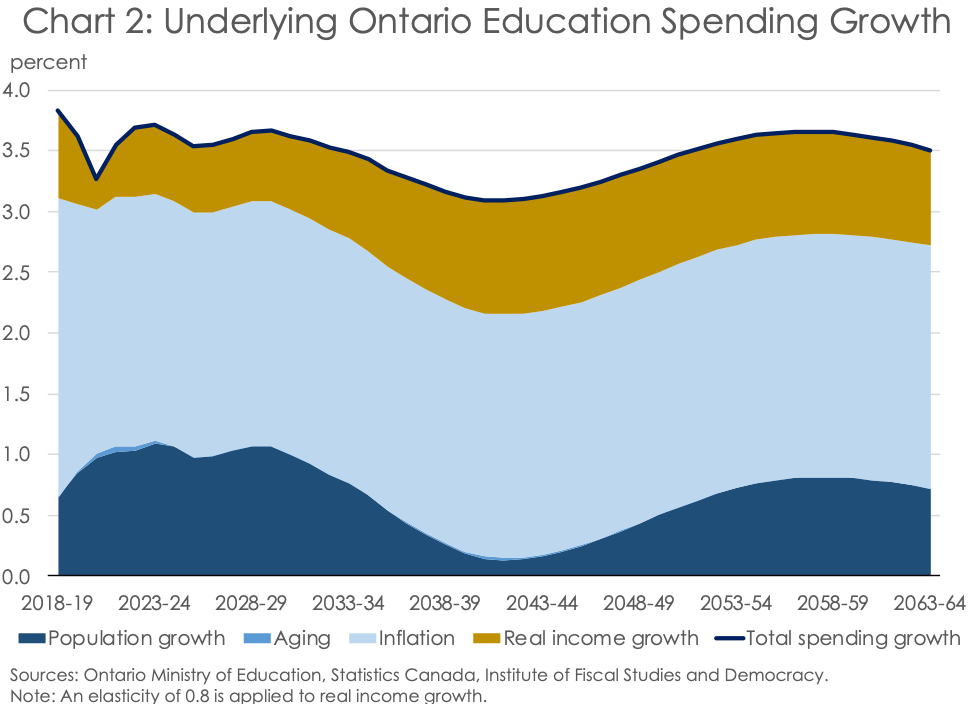
It is important to note that knowing which factors cause departmental spending to grow are just as critical as the amount the government spends. More specifically, if the department’s spending is growing predominantly due to forces that are mainly outside its control, it could be a challenge reduce spending. That situation is exactly the one that MoE finds itself in. Over the last decade, education spending has been heavily driven by factors such as demographics, inflation, and wage growth. Demographics and inflation are beyond government control. Wage growth is reliant on the collective agreement process with the teachers’ unions. While a number of teacher related contracts in Ontario are coming due in August 2019, salary renegotiations are not within the scope of this piece, and wage growth is held constant at a historical average. These factors have increased the cost of education an average of 4.4% year-over-year since 2009, and the IFSD forecasts it to remain around 3.5% until 2063 (Chart 2).
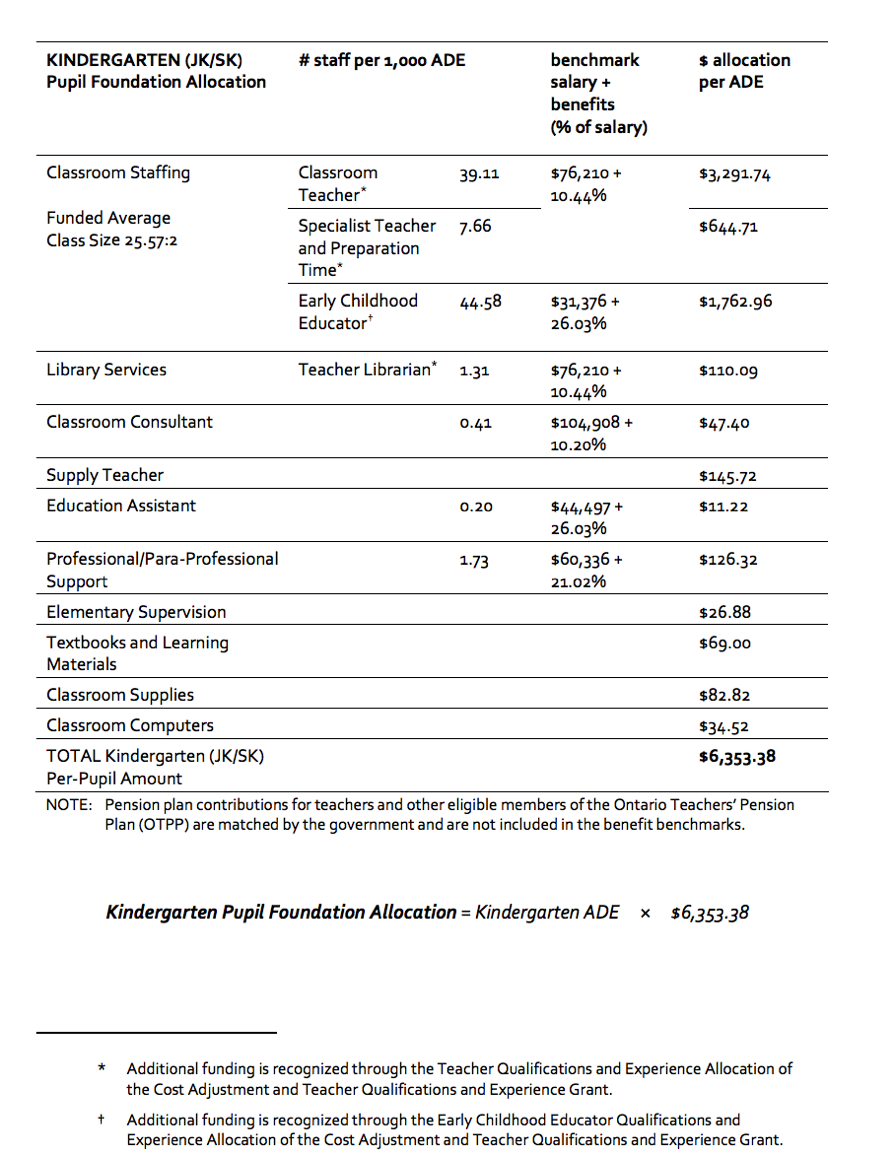
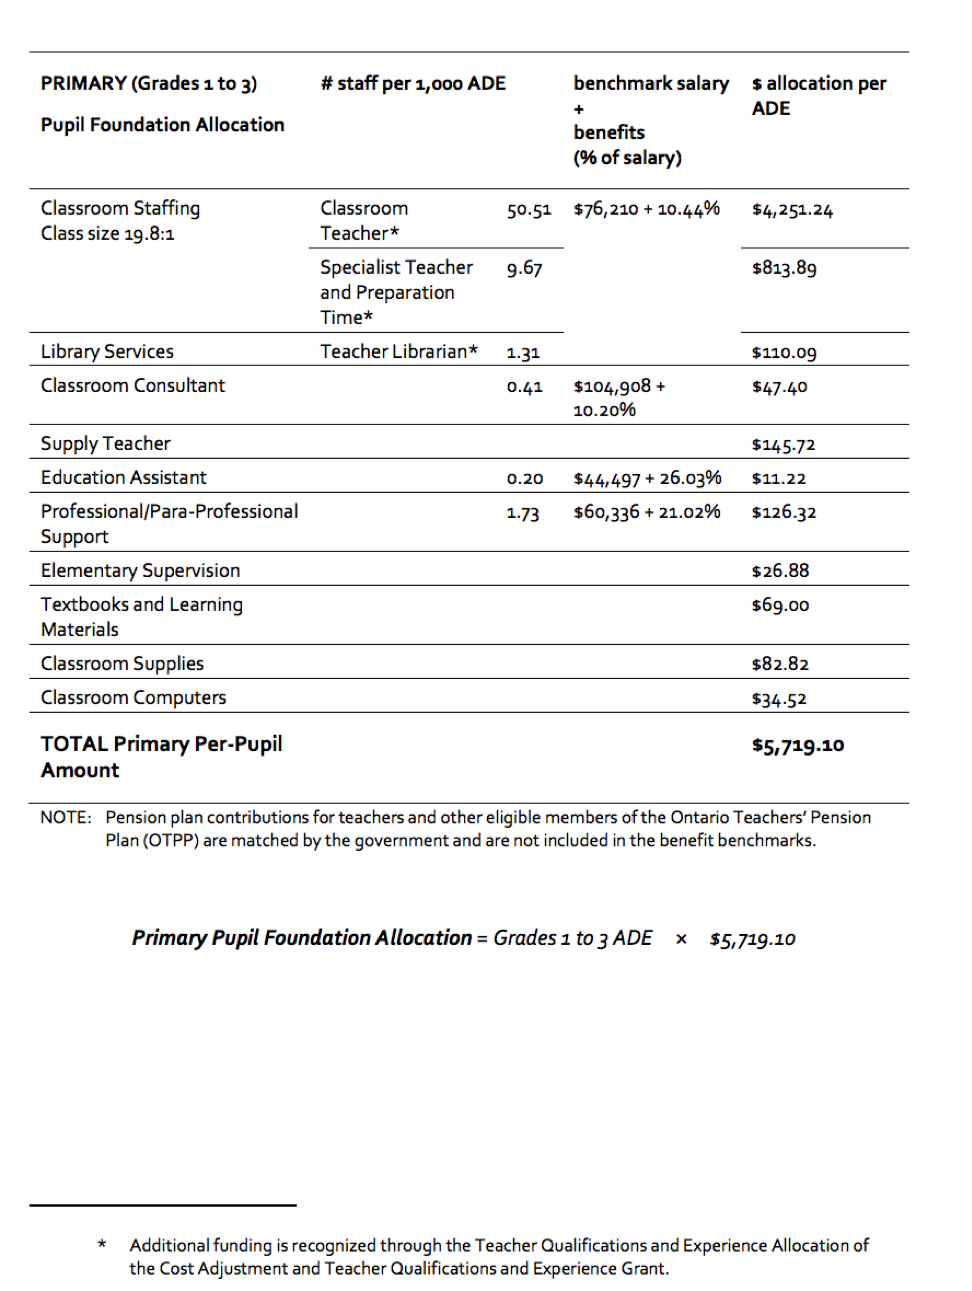
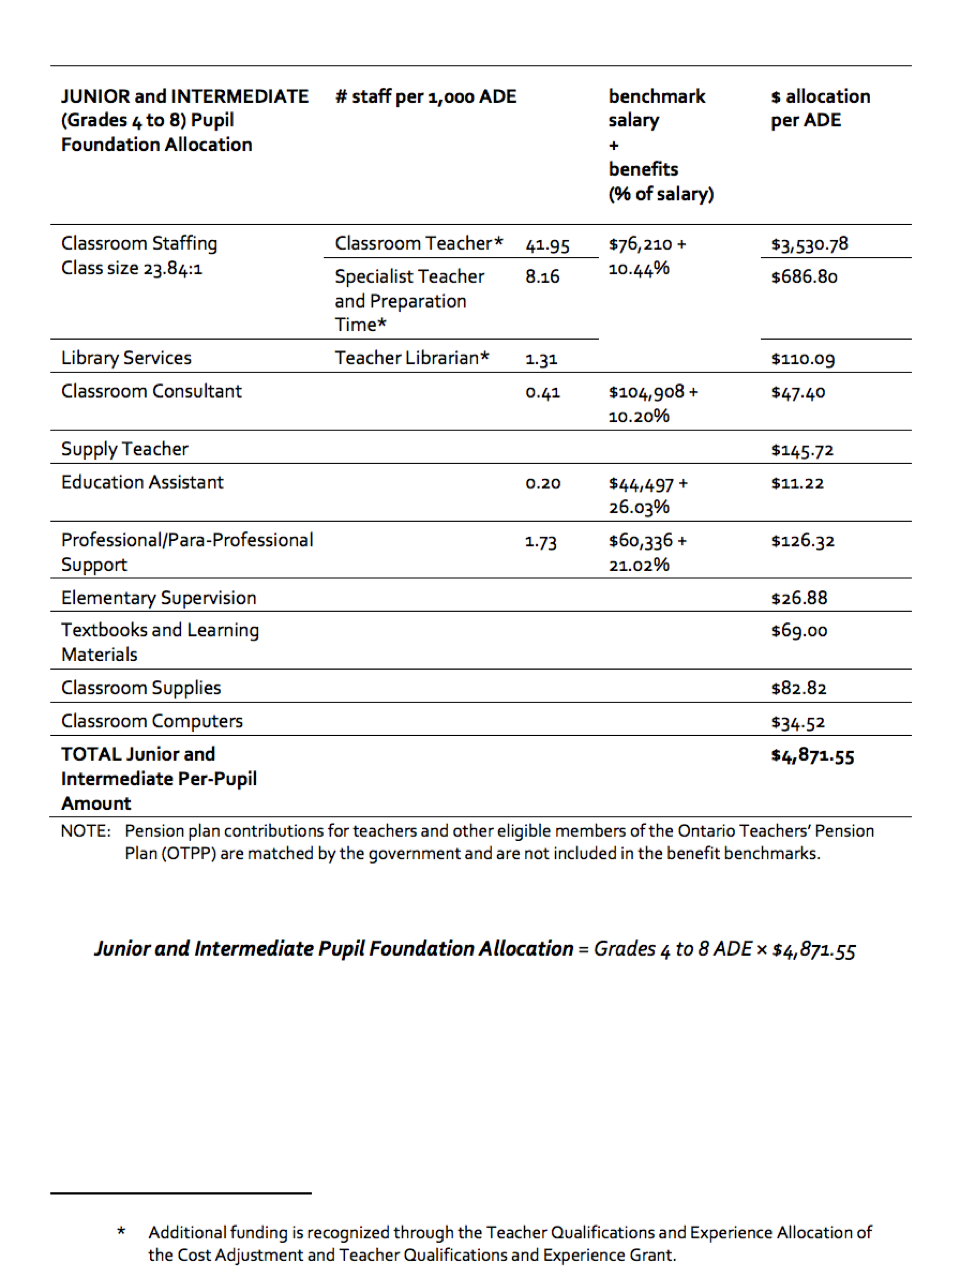
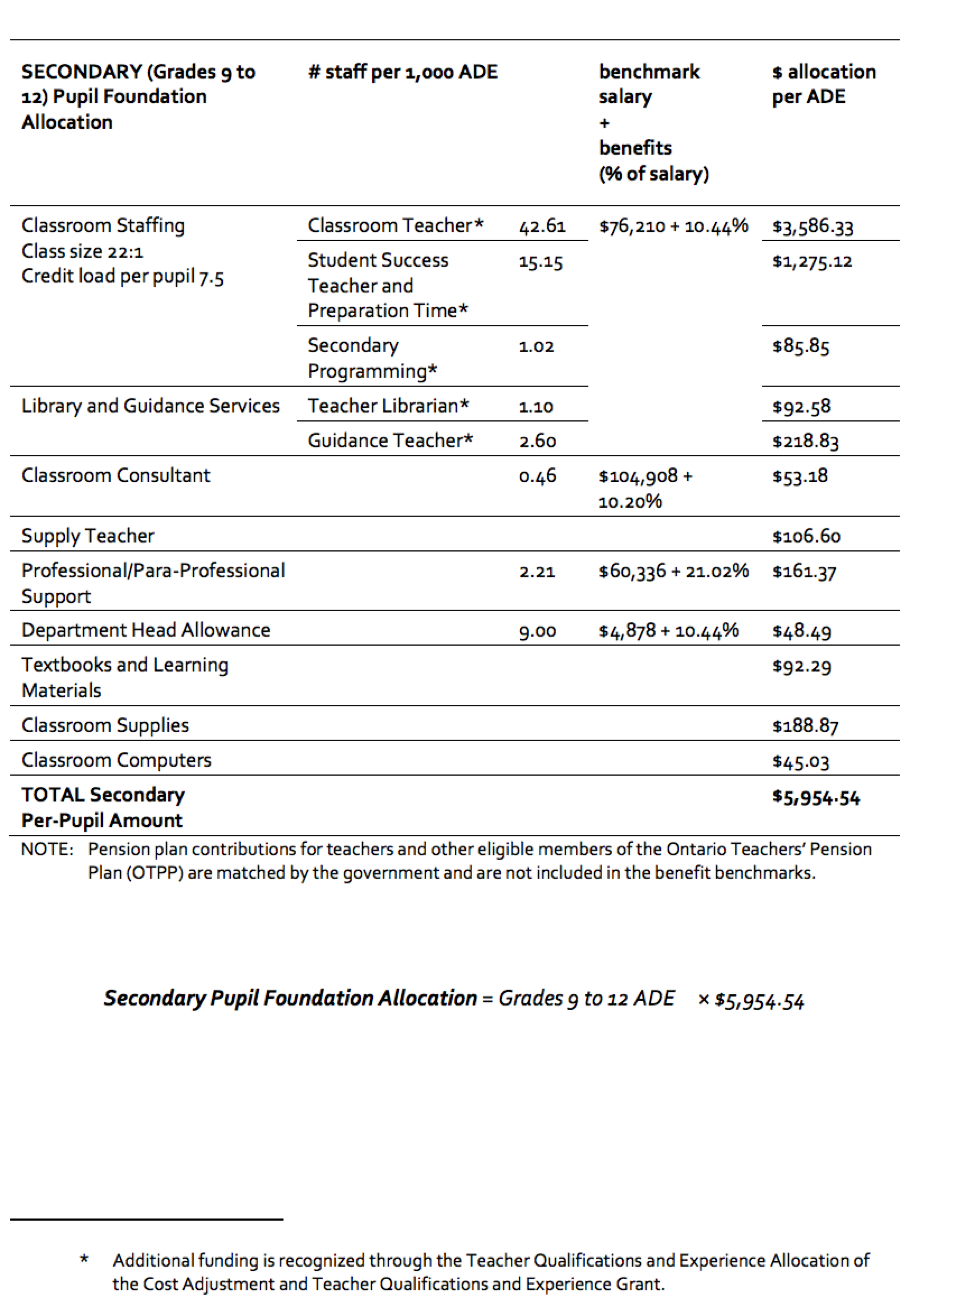
The provincial government, unable to heavily impact the rate of growth in the number of students, must then turn to possible considerations in reducing the amount it spends on education per student. Based on the funding formula found in the MoE technical papers, it is possible to estimate the cost-per-student cost from junior kindergarten to grade 12. This cost-per-student is calculated by dividing the benchmark salary of teachers and supplementary staff by the number of students they represent, then adding the cost-per-student of learning material and supplies (e.g. textbooks, science lab equipment, hardware/software etc.). Additionally, while the salary of a classroom teacher is divided by the number of students in the teacher’s class, the salary of a librarian or guidance teacher is divided by the number of total students served. This means that, while guidance teachers, librarians, and classroom teachers, are paid the same benchmark salaries, the salaries of classroom teachers are the largest drivers of spending because they are spread over a smaller number of students. For example, while the average cost per student in a secondary school (grade 9-12) class is approximately $6,000 - nearly 60% - goes to their teacher’s salary (Annex 1).
Estimated Savings Through Increased Class Sizes
Since the government cannot (easily) control inflation or demographics, it is left with few levers to reduce departmental spending. This leads us to the recent announcement from the Ontario government regarding education requirements – notably class size. As seen in below (Table 1), these changes heavily affect students in grades 9 to 12 (and to a lesser extent also affect students in grades 4 to 8). Increasing class size is not without controversy as reflected in recent student walkouts from classes.
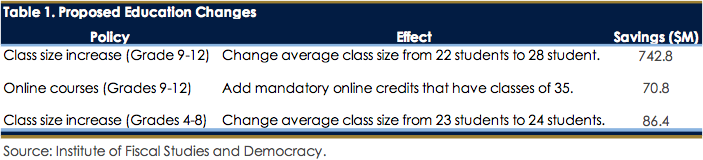
By increasing the class size of students in grades 9-12 from 22 to 28 students, the cost-per-student in 2018 would drop from $6,000 to $4,800, enabling a net savings of approximately $743 million per year. In addition, there is the inclusion of mandatory online courses, which will account for 13% of high school credits and will lead to further savings of around $70 million per year. These savings are further boosted by the one-student-per-class increase for grades 4-8, bringing the per-student cost from $4,900 to $4,700, driving additional savings of $86 million per year.
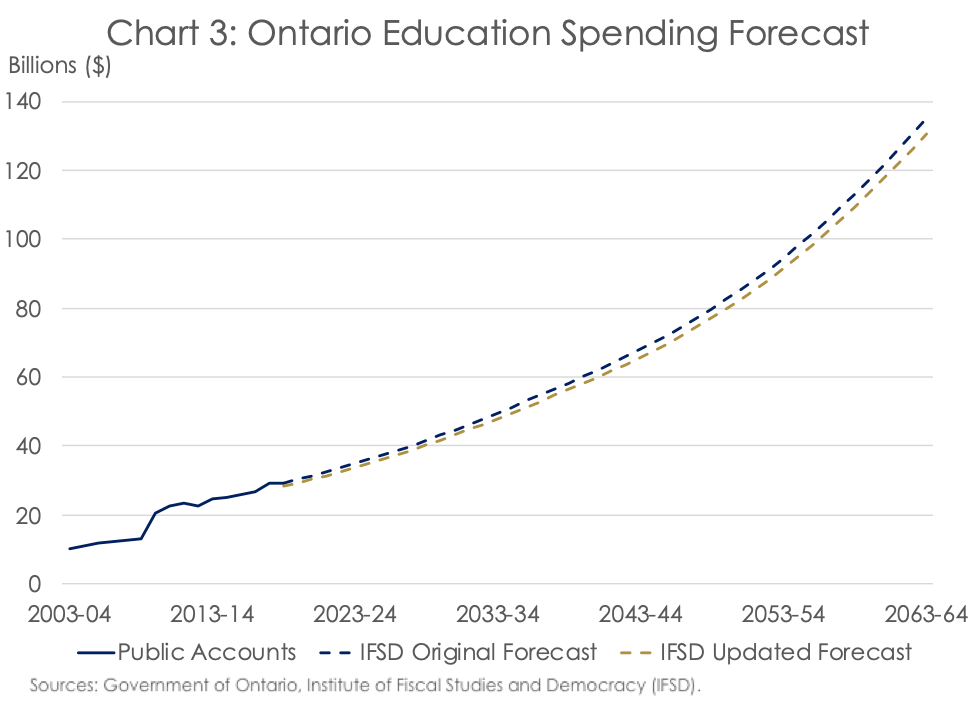
These savings are all driven by the reductions in teachers required on a per student basis, allowing for the remaining teachers’ salaries (note, the government has not proposed adjustments to the teachers’ salaries) to be divided amongst a greater number of students. By using the technical papers, we can estimate the number of teachers needed under different class scenarios by dividing the total student population in a given grade over class size. With these proposed policy changes, the IFSD estimates that the number of teachers in secondary school could drop by approximately 20%, while the number of teachers in grades 4-8 could fall by 3% (box 1). When taken together, these measures could lead to savings of approximately $900 million, growing to nearly $5 billion annually by 2063 (Chart 3).
|
Box 1: How many teachers could be affected Based on data from the yearly DoE Education Facts, and the Technical Papers, we can estimate how many Teaching jobs could be lost by the proposed policy changes. The most up to date education facts document points to there being just over 2 million students in the Primary and Secondary Ontario School system, with 710 thousand in grades 4-8, and 628 thousand in grades 9-12. Assuming a class size of 24 students in grades 4-8, and 22 students in grades 9-12, there would be approximately 58 thousand class room teachers between those two groups. If the number of students per class in each of those grades were to be increased to the proposed levels, we estimate that there would only be a need for 51 thousand teachers, resulting in a difference of approximately 6,900. This difference is likely to be the number of teachers that are targeted by the attrition measures proposed by the MoE. It should be noted that although this estimate is much larger than the MoE estimate of 3,400 teachers, that could be due to differences in methodology, or availability of data. |
In addition, the reduction in teachers could also lead to further efficiencies. This could occur due to the decrease in usage of the Teachers Qualification Grant Program (TQGP). The TQGP is used to supplement any teacher salaries and benefits above the benchmark amount, leading the TQGP to reach an estimated value of $1.8 billion in 2018. If higher salaried staff were to leave, it is very possible that this program would have less members drawing on it in the future. However, the specific impacts that the class size policies would have on this spending item is less clear and is therefore not quantified in the aforementioned savings estimate.
Will This Affect Students Performance?
While the research done above is focused only on the fiscal impact that these policies could bring, they could also bring with them a change to the education outcomes in Ontario – more students per teacher could reduce positive educational outcomes. Research done by Blatchford et al (2011), Brookings(2011), and Krassel and Heinesen (2013), discuss policy impacts on student outcomes. The studies by both Blatchford, and Krassel, show that there is a definitive link between class sizes and outcomes, with Brookings building on similar research to discuss the results of many other studies done regarding class sizes. Overall, these authors show that class sizes can be linked to education outcomes with varying effect. In the earlier years of education there are noticeable impacts related to class sizes, but as one looks at the impacts on secondary school, the effects are more muted. When taken in conjunction, these different areas of research can be combined to allow for a more wholistic conversation of the intersection between classroom sizes, teacher compensation, and the cost of education for the government.
The savings have to come from somewhere
Analyzing education spending requires debate and deliberations around the quality of schooling for Ontario students and well as the jobs of teachers. However, there appears to be less discussion on the financial impact of specific measures needed to reach the fiscal targets.
The reality is that the Ontario government was elected on a platform that promised reduced spending while leaving taxes unchanged; so, the savings have to come from somewhere. In the case of Ontario, where Healthcare, Education, and Community Services are considered to be the most indispensable services, they also account for nearly 70% of government spending. It is hard to avoid touching the “Big 3” in an effort to the change the province’s fiscal trajectory.
Annex 1: Spending Breakdown by Grade from Technical Paper 2018-19
*Average Daily Enrolment (ADE) is equal to the average amount of Full Time Equivalent Students enrolled during both winter and fall.